The Report and Visualization dashboard allows users to easily review, visualize, and report boring information collected during field activities and laboratory results for geotechnical samples. This dashboard has eight sections configured to display as horizontal tabs:
•Boring Logs and Subsurface Profiles
•Moisture and Atterberg Limits
•Compaction - Moisture Density
Click the desired tab to navigate to that portion of the dashboard. Select the Filter tab to display the EQuIS Geotech side menu.
Filter Tab
The Filter tab on the Report and Visualization dashboard contains a Map widget and a Data Grid widget (i.e., Boring ID Filter)configured to filter by location.
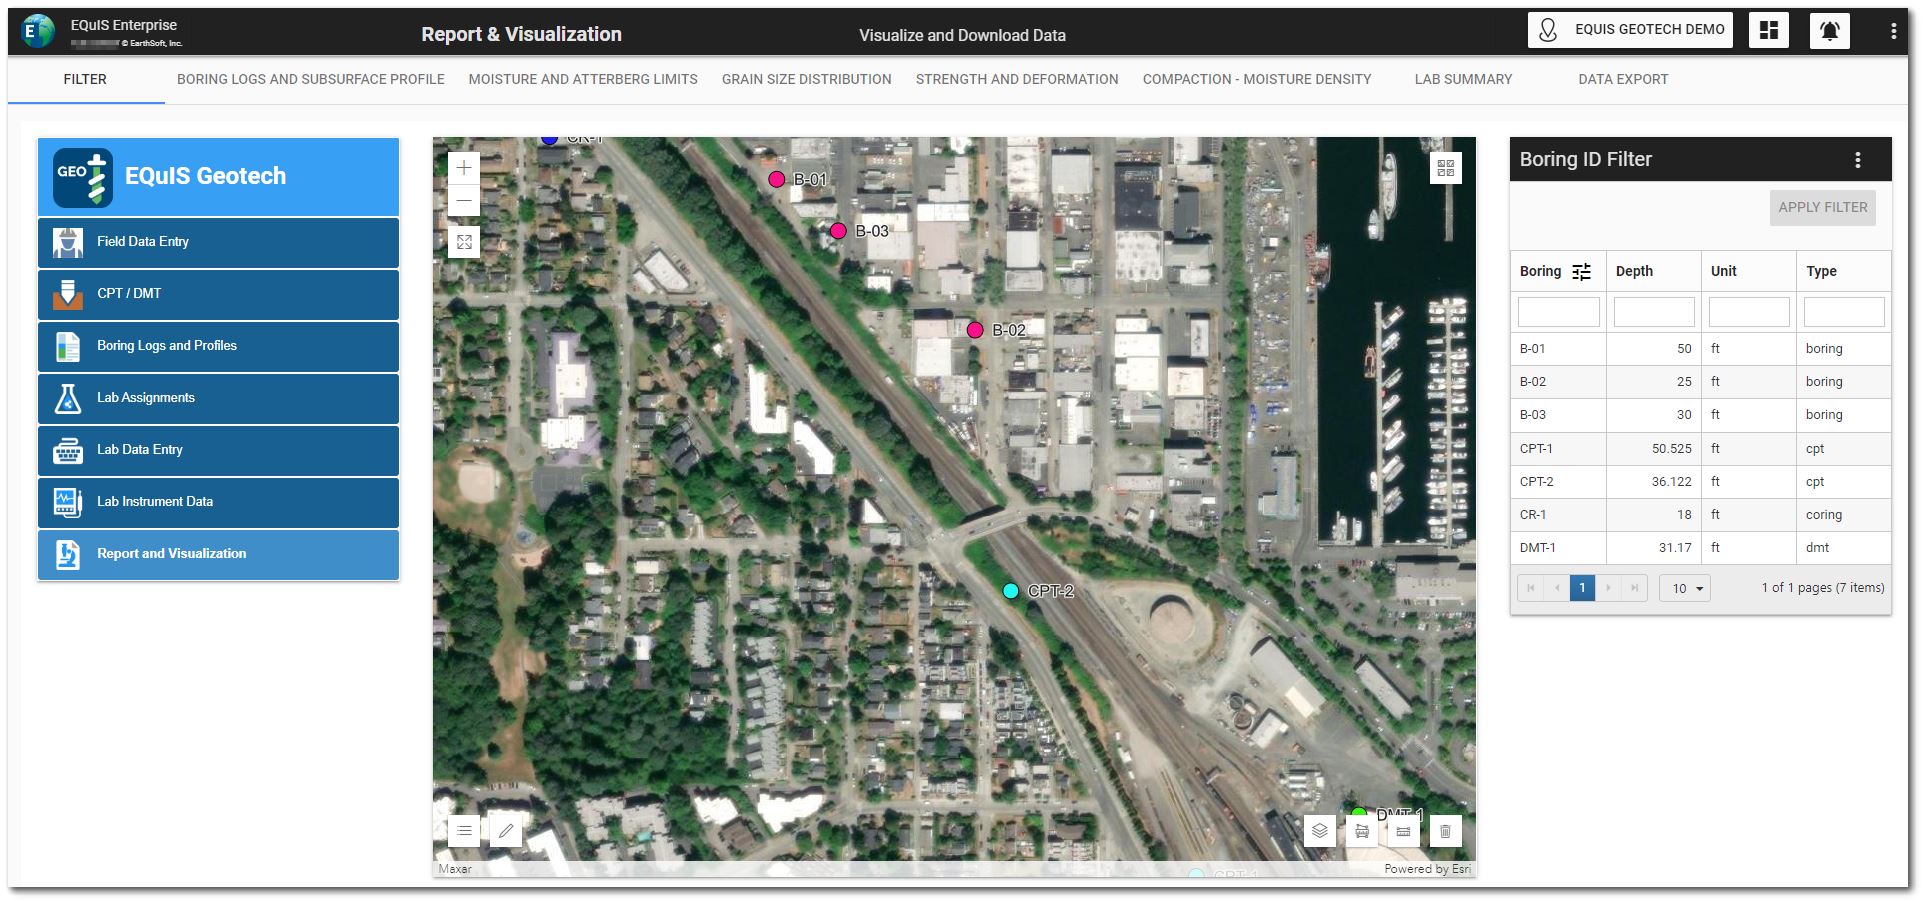
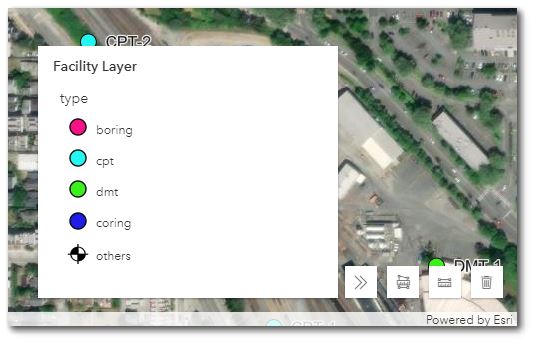
The Facility Layer on the Map widget can be configured to differentiate between the type of drilling/boring locations.
To filter the Map widget, select the desired boring(s) in the Boring ID Filter widget. Use the Shift and/or Ctrl keys to select multiple locations. Click the Apply Filter button to activate the filtering. The Boring IDs will be displayed at the top of the widget. Click the Clear button to clear filtering.
Boring Logs and Subsurface Profiles Tab
The Boring Logs and Subsurface tab on the dashboard is designed to populate Boring Log(s) and Well Construction Log(s) based on location(s) selected by the user.
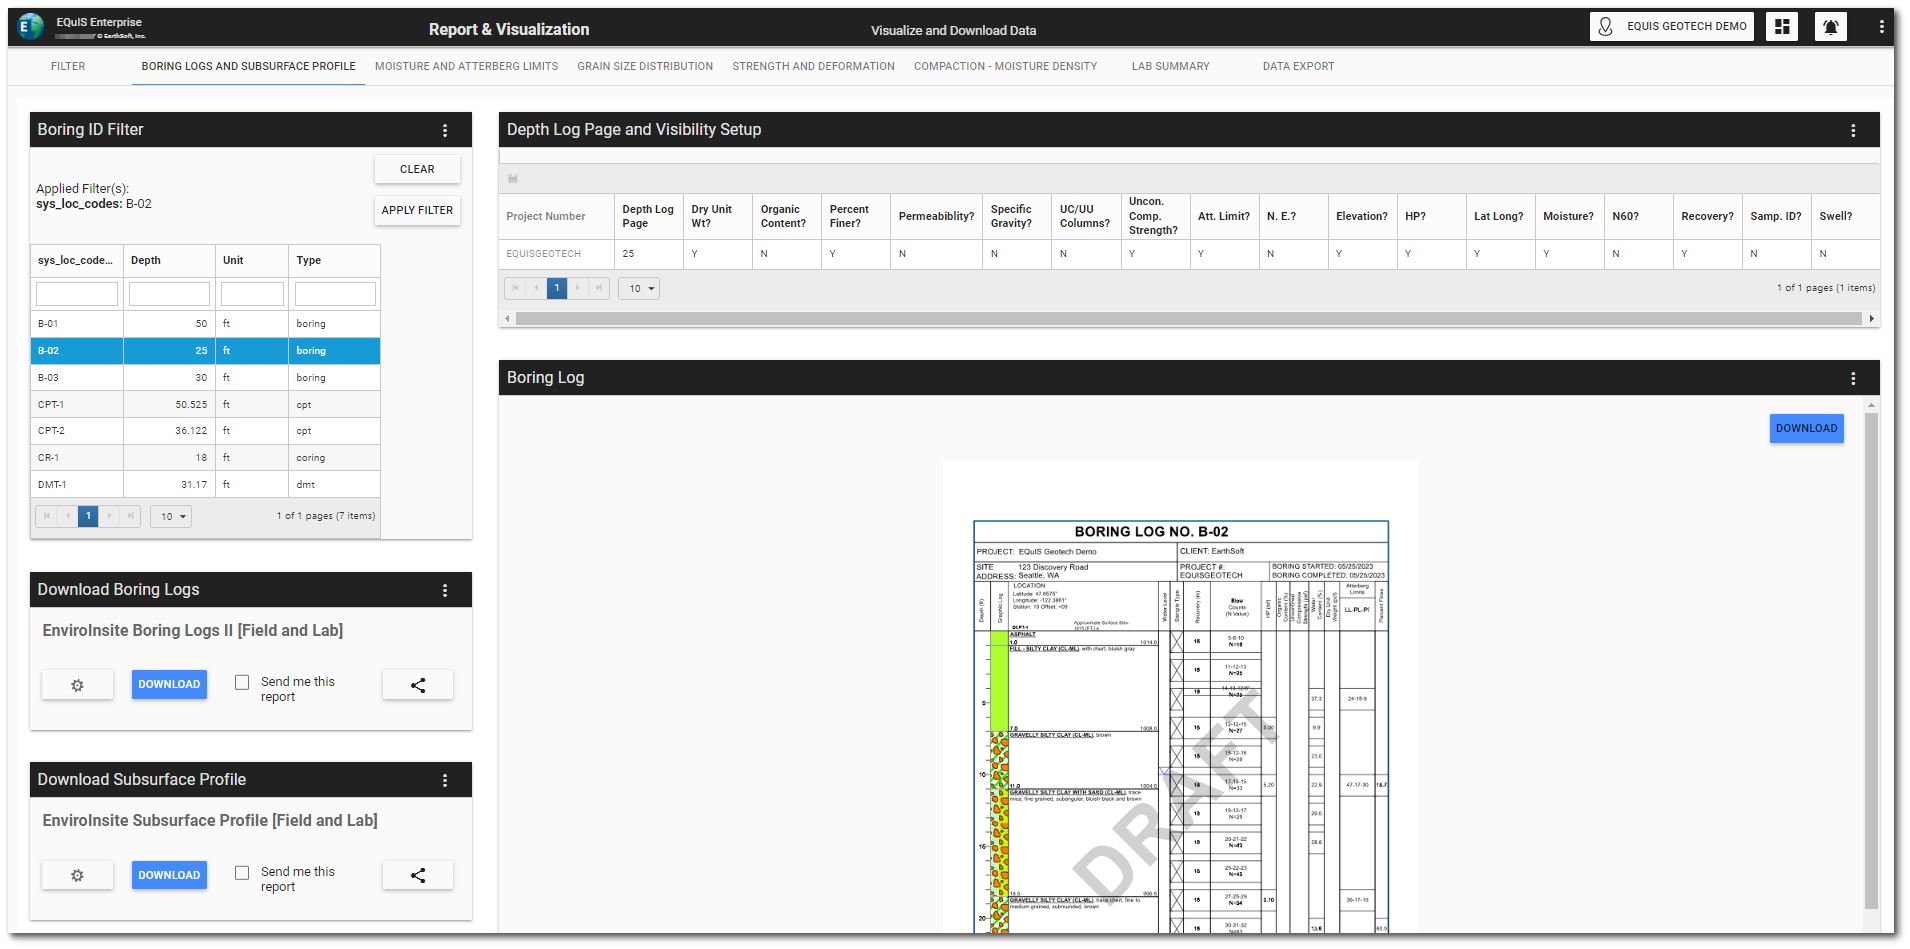
The dashboard tab contains a Boring ID Filter widget,, an EZView widget (i.e., Download Boring Logs) configured with the EnviroInsite Boring Logs II Report, and a Boring Log widget configured to use the EarthSoft_StandardGeoField_BLTemplate.xml template file with the EnviroInsite Boring Logs II Report output.
Select the desired boring locations in the Boring ID Filter widget if not selected on the Filter tab. Use the Shift and/or Ctrl keys to select multiple locations. Click the Apply Filter button to activate the filtering on the associated EnviroInsite Boring Logs II reports and log widgets. The selected Boring ID(s) will be displayed at the top of the Boring ID Filter widget.
The "Depth Log Page and Visibility Setup" widget is a pre-configured EQuIS Geotech - Project Parameter Setup widget. Settings on the widget control how the boring logs will be displayed/output on the Boring Log widget. Visibility of various data can be turned on and off in the widget. Enter "Y" in the appropriate column to display the data on the log. Enter "N" in the appropriate column to not display the data on the log. Click the Save icon in the left side of the frame to change the settings. After making changes, click the Apply Filter button on the Boring ID Filter widget to activate the changes in the report and on the boring log.
Click the Download button to download the report and the boring log(s), respectively.
Click the Clear button on the Boring ID Filter widget to clear the filtering.
Moisture and Atterberg Limits Tab
The Moisture and Atterberg Limits tab on the dashboard contains a Map widget, Boring ID Filter widget, and two EZView widgets for reports.
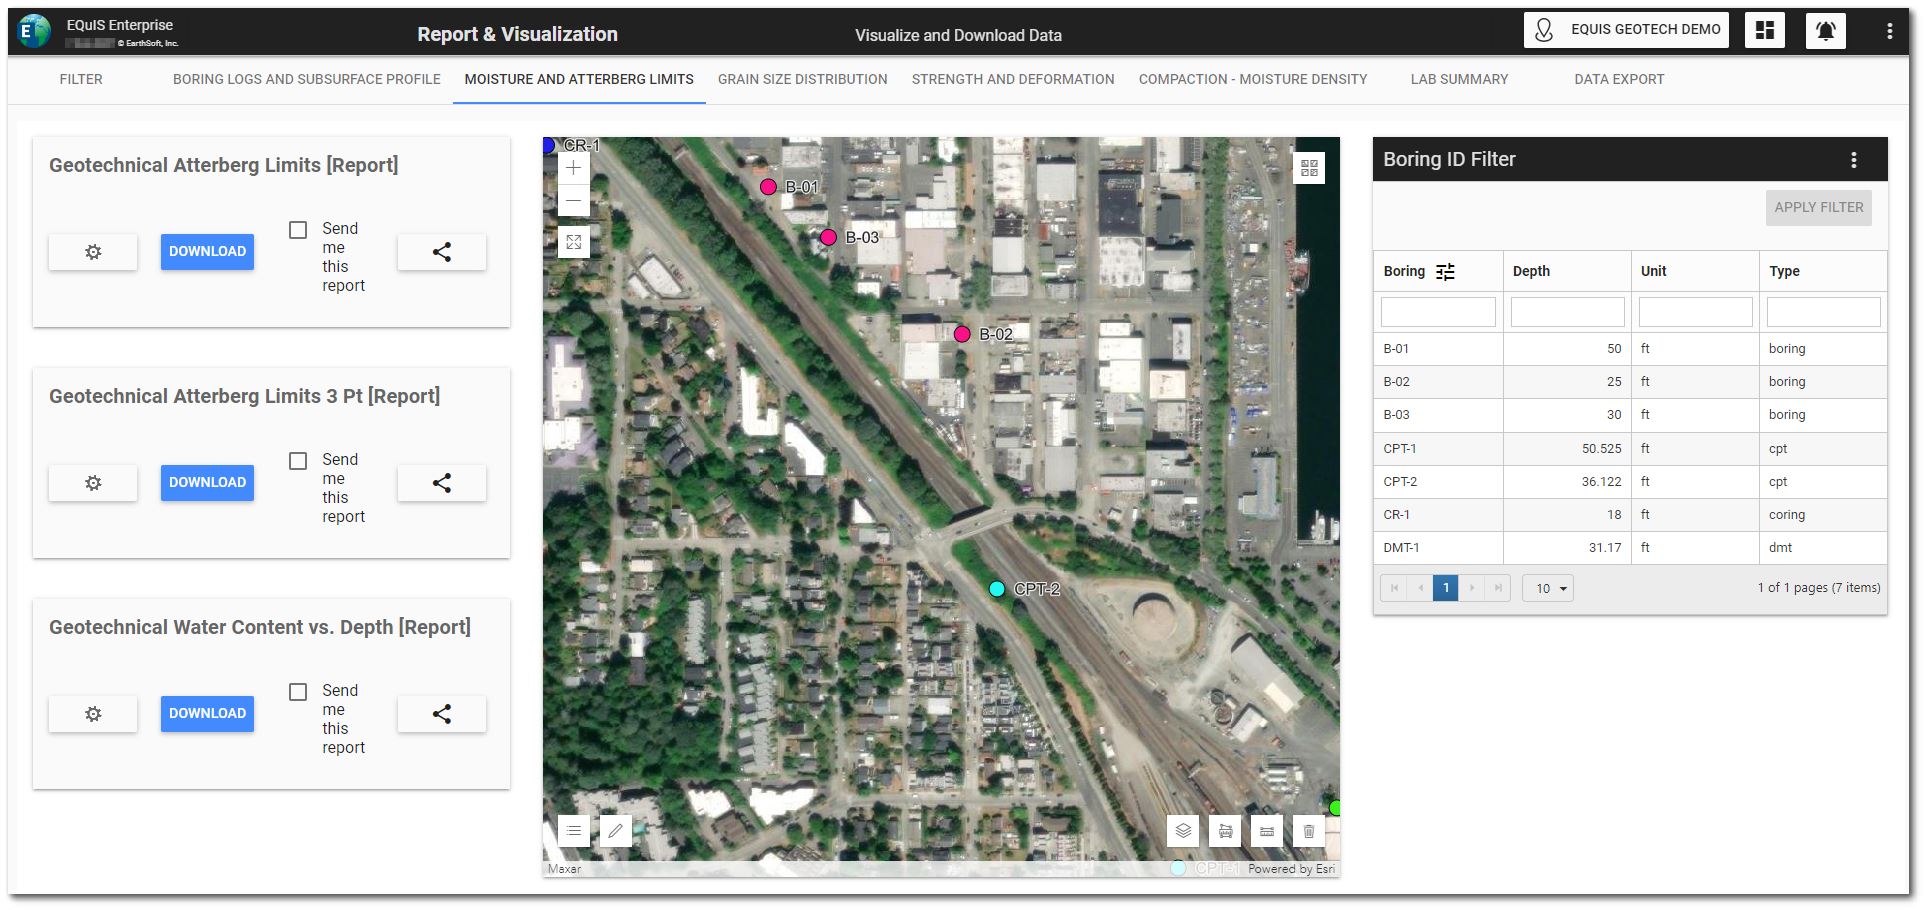
The Atterberg Limits Report widget is configured to use the Geotechnical Atterberg Limits report with the EarthSoft_AtterbergLimits.xlsx template file.
The Atterberg Limits 3 Point Report widget is configured to use the Geotechnical Atterberg Limits 3 Point report with the EarthSoft_AtterbergLimits_3Point.xlsx template file.
Select the desired boring locations in the Boring ID Filter widget if not selected on the Filter tab. Use the Shift and/or Ctrl keys to select multiple locations. Click the Apply Filter button to activate the filtering on the associated reports. The selected Boring ID(s) will be displayed at the top of the Boring ID Filter widget.
Click the Download button on a report widget to download the report.
Click the Clear button on the Boring ID Filter widget to clear the filtering.
Grain Size Distribution Tab
The Grain Size Distribution tab on the dashboard contains a Map widget, Boring ID Filter widget, and four EZView widgets for reports.
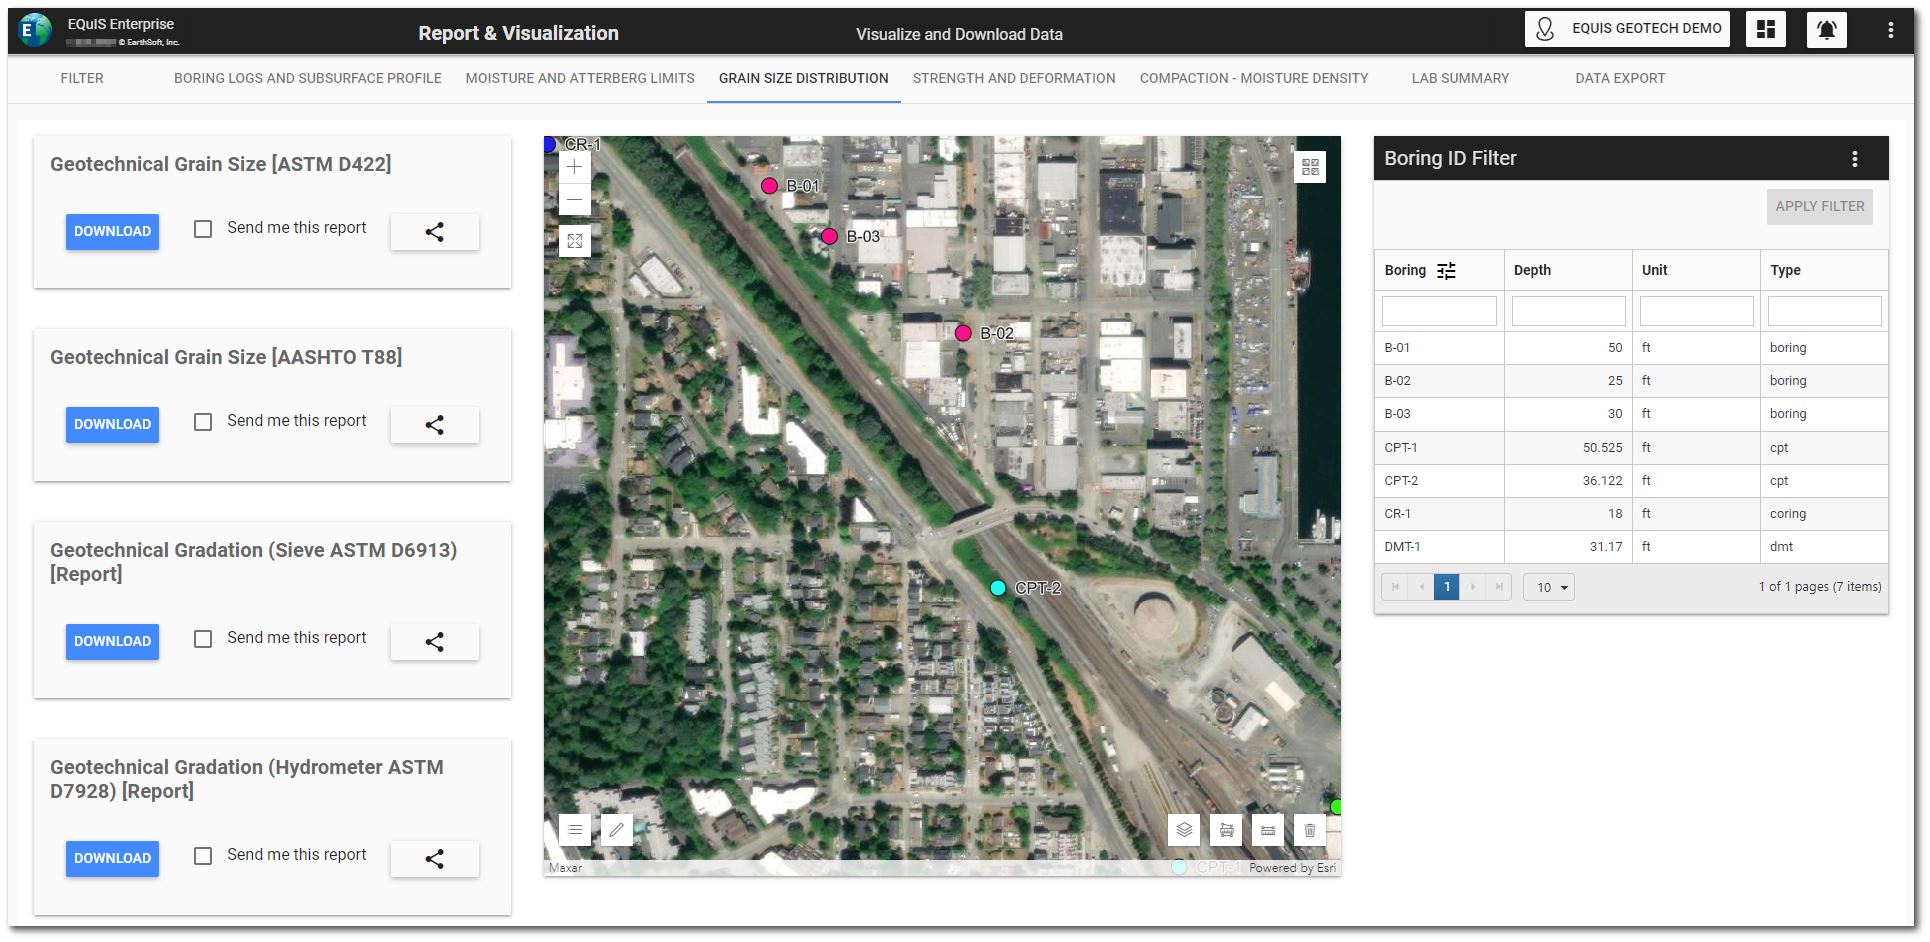
The Grain Size Analysis D422 Report widget is configured to use the Geotechnical Grain Size Analysis report with the EarthSoft_GrainSizeAnalysis_ASTMD422.xlsx template file.
The Grain Size Analysis - AASHTO T-88 Report widget is configured to use the Geotechnical Grain Size Analysis report with the EarthSoft_GrainSizeAnalysis_AASHTOT88.xlsx template file.
The Sieve Analysis - ASTM D6913 Report widget is configured to use the Geotechnical Gradation (Sieve) - ASTM D6913 report with the EarthSoft_GrainSizeAnalysis_ASTMD6913.xlsx template file.
The Hydrometer Analysis - ASTM D7928 Report widget is configured to use the Geotechnical Gradation (Hydrometer) - ASTM D7928 report with the EarthSoft_Hydrometer_ASTMD7928.xlsx template file.
Select the desired boring locations in the Boring ID Filter widget if not selected on the Filter tab. Use the Shift and/or Ctrl keys to select multiple locations. Click the Apply Filter button to activate the filtering on the associated reports. The selected Boring ID(s) will be displayed at the top of the Boring ID Filter widget.
Click the Download button on a report widget to download the report.
Click the Clear button on the Boring ID Filter widget to clear the filtering.
Strength and Deformation Tab
The Strength and Deformation tab on the dashboard contains a Map widget, Boring ID Filter widget, and two EZView widgets for reports.
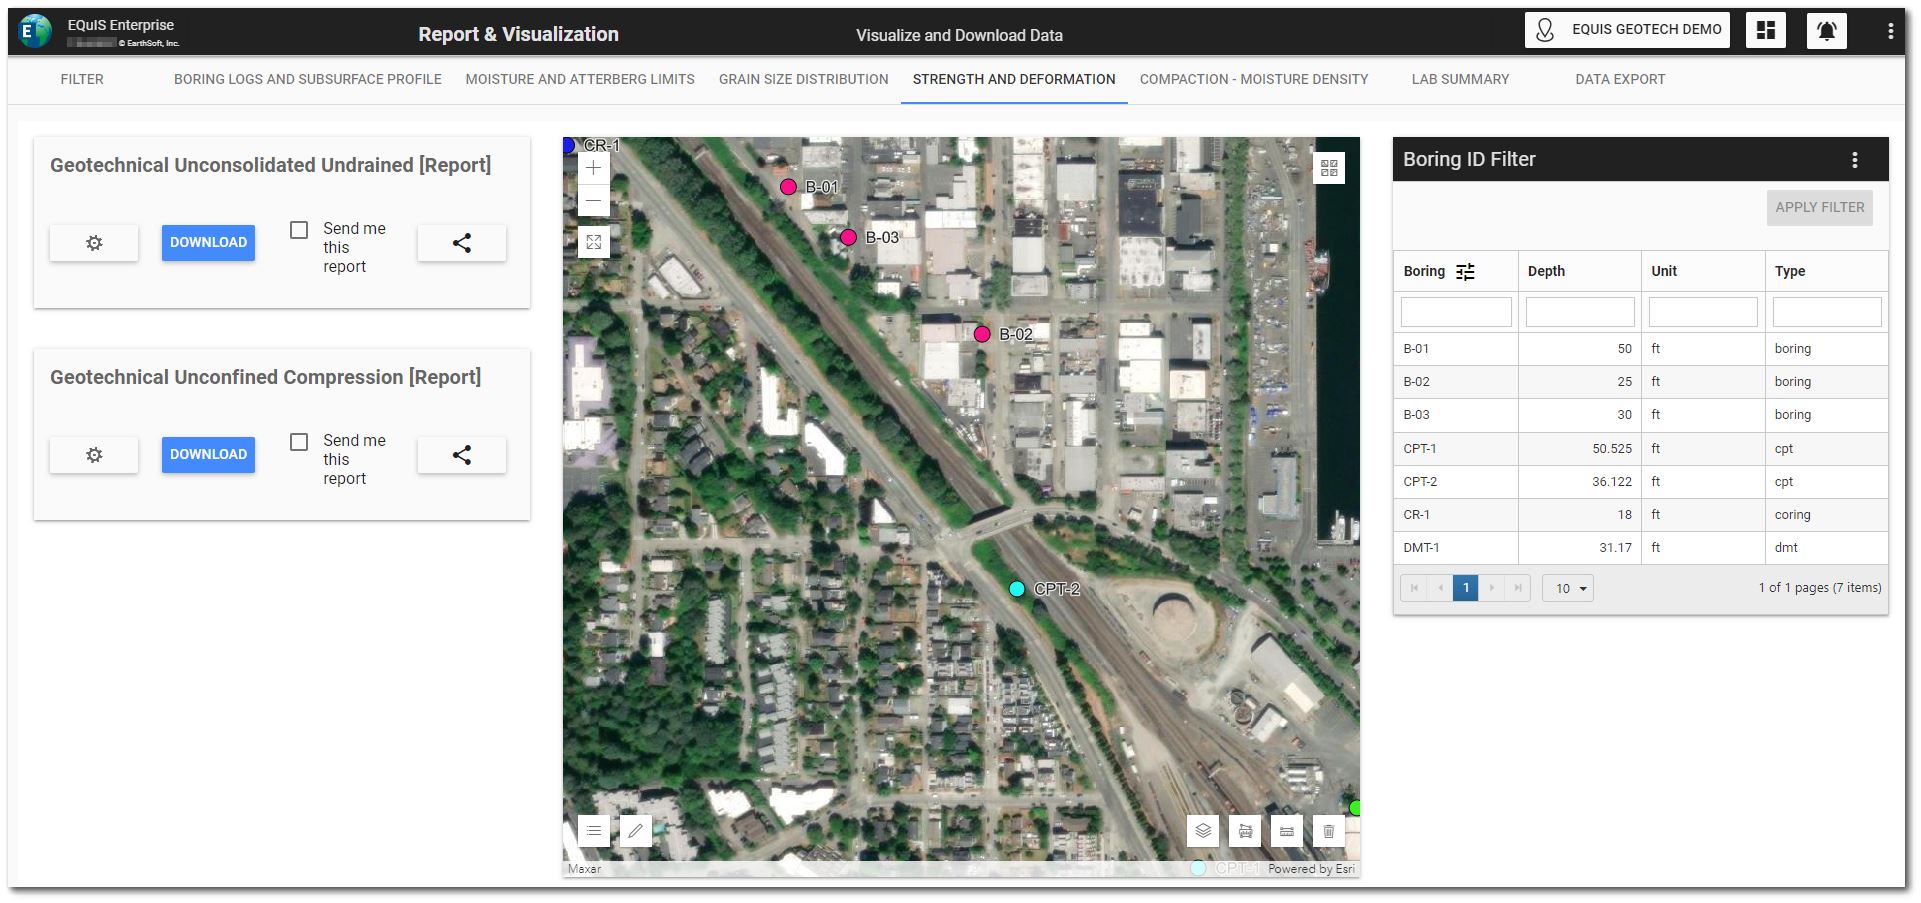
The Unconsolidated Undrained Report widget is configured to use the Geotechnical Unconsolidated Undrained report with the EarthSoft_Unconsolidated_Undrained.xlsx template file.
The Unconfined Compression Report widget is configured to use the Geotechnical Unconfined Compression report with the EarthSoft_Unconfined_Compression.xlsx template file.
Select the desired boring locations in the Boring ID Filter widget if not selected on the Filter tab. Use the Shift and/or Ctrl keys to select multiple locations. Click the Apply Filter button to activate the filtering on the associated reports. The selected Boring ID(s) will be displayed at the top of the Boring ID Filter widget.
Click the Download button on a report widget to download the report.
Click the Clear button on the Boring ID Filter widget to clear the filtering.
Compaction - Moisture Density Tab
The Compaction - Moisture Density tab on the dashboard contains a Map widget, Boring ID Filter widget, and an EZView widget for reports.
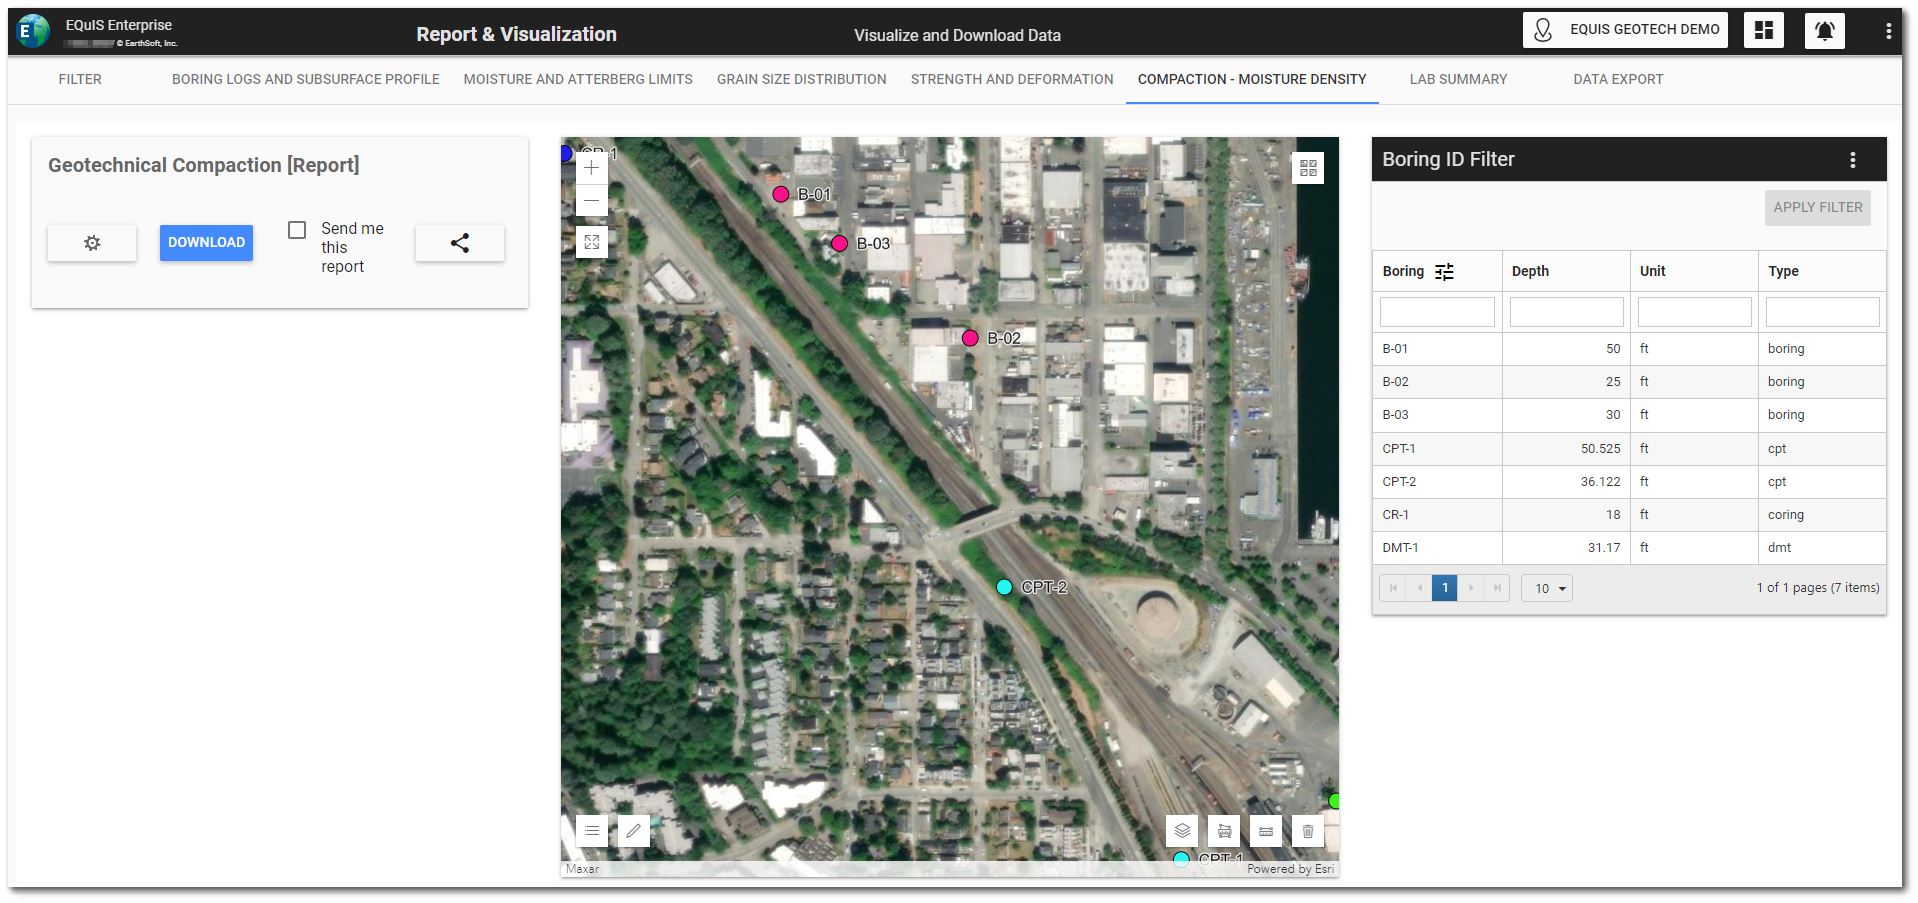
The Compaction - Moisture Density Report widget is configured to use the Geotechnical Compaction report with the EarthSoft_Compaction.xlsx template file.
Select the desired boring locations in the Boring ID Filter widget if not selected on the Filter tab. Use the Shift and/or Ctrl keys to select multiple locations. Click the Apply Filter button to activate the filtering on the associated reports. The selected Boring ID(s) will be displayed at the top of the Boring ID Filter widget.
Click the Download button on the report widget to download the report.
Click the Clear button on the Boring ID Filter widget to clear the filtering.
Lab Summary Tab
The Lab Summary tab on the dashboard contains a Data Grid widget, Boring ID Filter widget, and an EZView widget for reports.
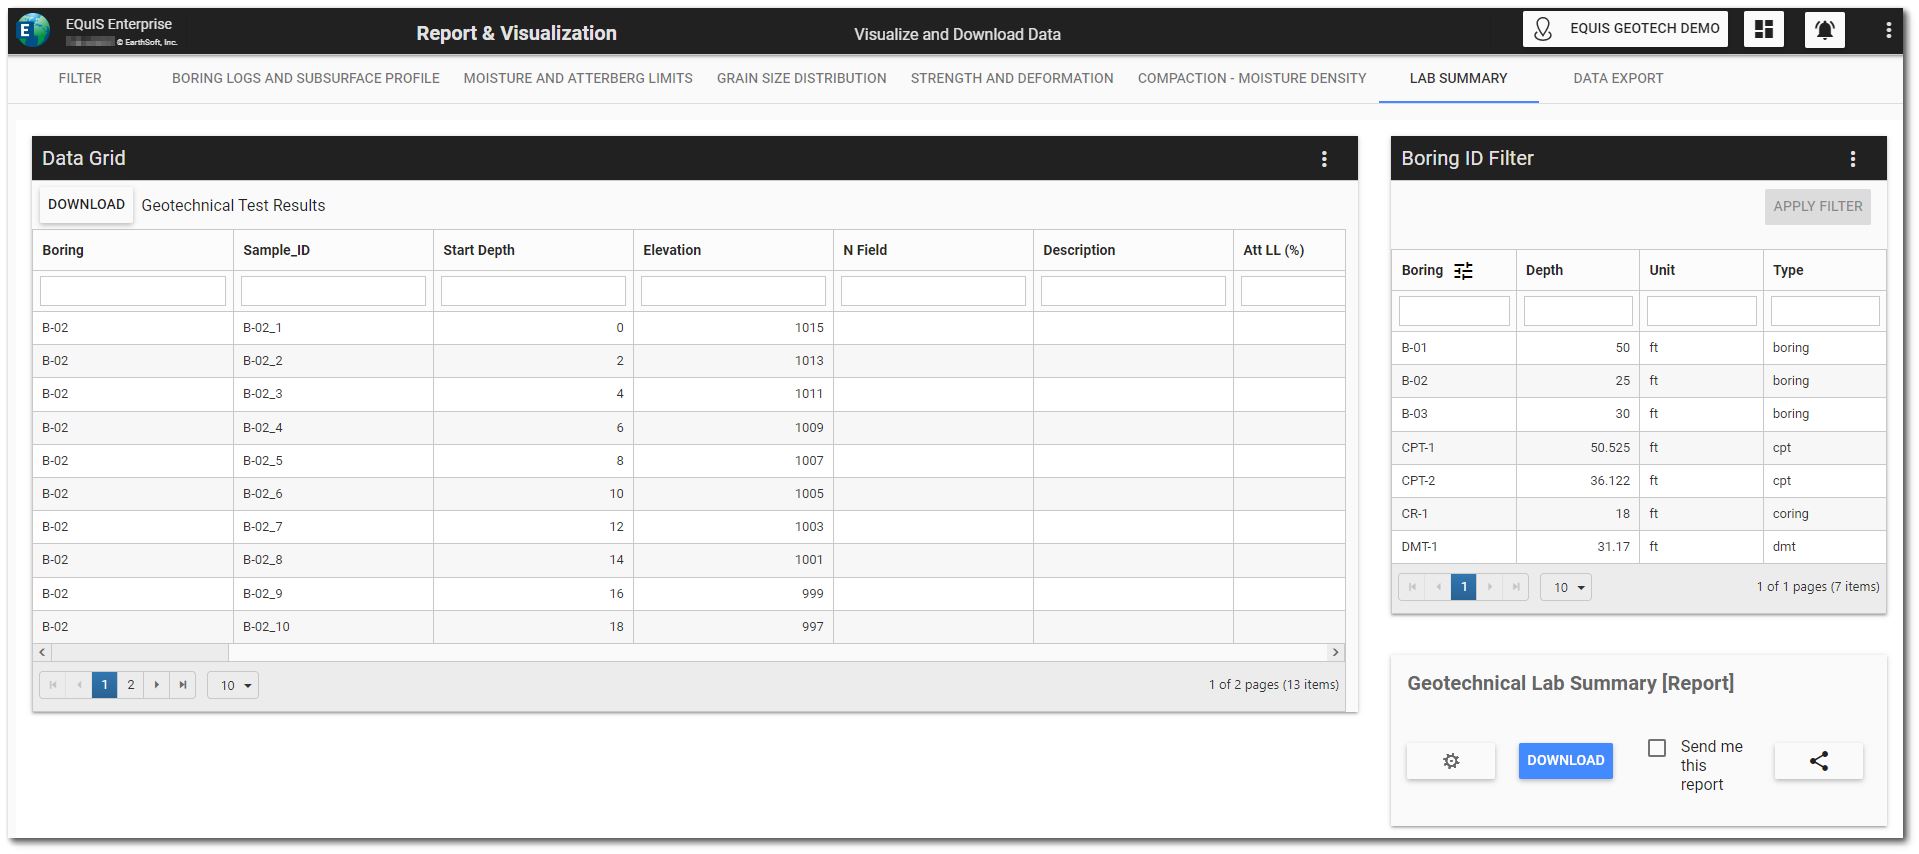
The Lab Summary Report widget is configured to use the Geotechnical Lab Summary report with the EarthSoft_GeoLabSummary_Max15Columns.xlsx template file.
Select the desired boring locations in the Boring ID Filter widget if not selected on the Filter tab. Use the Shift and/or Ctrl keys to select multiple locations. Click the Apply Filter button to activate the filtering on the associated reports. The selected Boring ID(s) will be displayed at the top of the Boring ID Filter widget.
Click the Download button on the report widget to download the report.
Click the Clear button on the Boring ID Filter widget to clear the filtering.
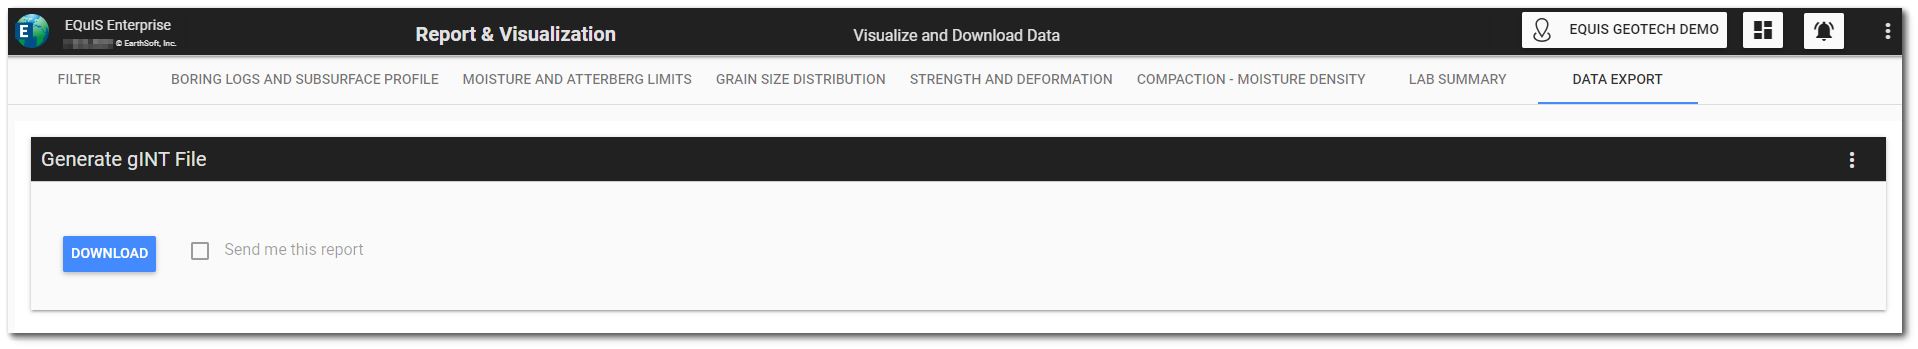
Data Export Tab
The Data Export tab on the dashboard contains an EZView widget to export data compatible with gINT.