Report Name: Geotechnical Lab Summary (example)
File Name: EarthSoft.Reports.Library.176839.dll
Dependencies: Licensed EQuIS Geotech and Geotech Schema
Software: EQuIS Professional and Enterprise
Source: EQuIS Geotech (EarthSoft Community Center > Products > EQuIS Geotech)
Language: English
Output Type: Excel1 or PDF
Description: The Geotechnical Lab Summary report outputs data for selected fields in a table format using a selected template. The user has the option to display data from various tables in the database. This report filters the results based on the selected task(s). This report can be run in EQuIS Professional or published to EQuIS Enterprise.
Installation Instructions: This report requires an EQuIS Geotech license and the Geotech Schema applied to the database. The Geotechnical Lab Summary report (EarthSoft.Reports.Library.176839.dll) is available for download in the Products\EQuIS Geotech folder on the Downloads Dashboard on the EarthSoft Community Center. For Enterprise use, this report should be published to the database. When publishing the report, the assembly should be stored in the database. The report will be available for selection once it has been published.
Additional Details:
This report dynamically displays the selected parameters in a table grid format. Users can select which information to display by directly selecting any columns within the DT_LOCATION, DT_SAMPLE, DT_GEO_STANDARD_PENETRATION, and DT_GEO_CORING tables as well as from test-result pairs or calculated information. Users are also able to select formatted columns to display (see the “Display Formatted Data” Parameter Configuration section on how to properly configure these columns).
The report populates the data in the template by following these conditions:
•DT_GEO_STANDARD_PENETRATION and DT_GEO_CORING records are matched to DT_SAMPLE records using FACILITY_ID, SYS_LOC_CODE, START_DEPTH, and END_DEPTH.
•When START_DEPTH and END_DEPTH are populated in both DT_GEO_STANDARD_PENETRATION and DT_GEO_CORING tables, samples will be matched to DT_GEO_STANDARD_PENETRATION and DT_GEO_CORING records where DT_SAMPLE.START_DEPTH and DT_SAMPLE.END_DETPH is between the start and end depths in DT_GEO_STANDARD_PENETRATION or DT_GEO_CORING.
•If DT_SAMPLE.END_DEPTH is null, samples will be matched where DT_SAMPLE.START_DEPTH is greater than or equal to the start depth and less than the end depths in DT_GEO_STANDARD_PENETRATION or DT_GEO_CORING.
•If DT_GEO_STANDARD_PENETRATION or DT_GEO_CORING end depths are null, samples will be matched where start depths are equal to DT_SAMPLE.START_DEPTH.
•‘Display Formatted Data’ precedes the other report options. The order in which these parameters display is based on the order defined in RT_REMAP_DETAIL.REMARK.
•Within each of the ‘Display Raw Data’ sections, the report determines the order of display alphabetically.
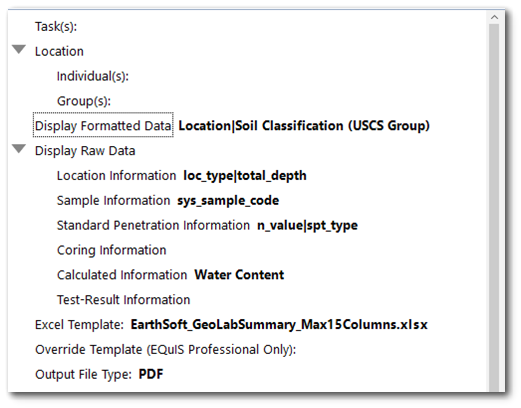
For example, if a user selects the parameters shown in the image below, the parameters would display in the following order: Location, Soil Classification (USCS Group), loc_type, total_depth, sys_sample_code, n_value, spt_type, Water Content.
Notes: •Water Content values are reported using the following hierarchy order: •Depth units are not converted and are expected to be consistent between DT_SAMPLE, DT_GEO_STANDARD_PENETRATION, and DT_GEO_CORING. |
This report supports task_code based paging.
Template:
The Geotechnical Lab Summary report is designed to use a selected Microsoft Excel template. The chosen template must be able to support the number of parameters selected. Based on the number of selected parameters, the report selects the correct sheet in the template to populate with data. If a user selects a template that supports outputting 10 parameters and they select more than 10 parameters, the extra parameters will not display (e.g., If the user selects 14 parameters, the last 4 will not display).
Note: The EarthSoft_GeoLabSummary_Max15Columns.xlsx template file is provided with EQuIS Geotech. This template supports a minimum of 4 parameters and a maximum of 15 columns. See the template configuration information below and the Geotechnical Template Configuration article for detailed information on editing/creating Excel templates for use with EQuIS Geotech reports. |
Template worksheet must be called Report_n where n is the number of columns which are able to display on one page. For example, a template worksheet called “Report_6” would allow for 6 columns to display on a sheet.
In addition to the Shared Attributes detailed in the Shared Report Attributes article, users should configure their template with the following Name Manager Fields.
Excel Name Manager |
Description |
|---|---|
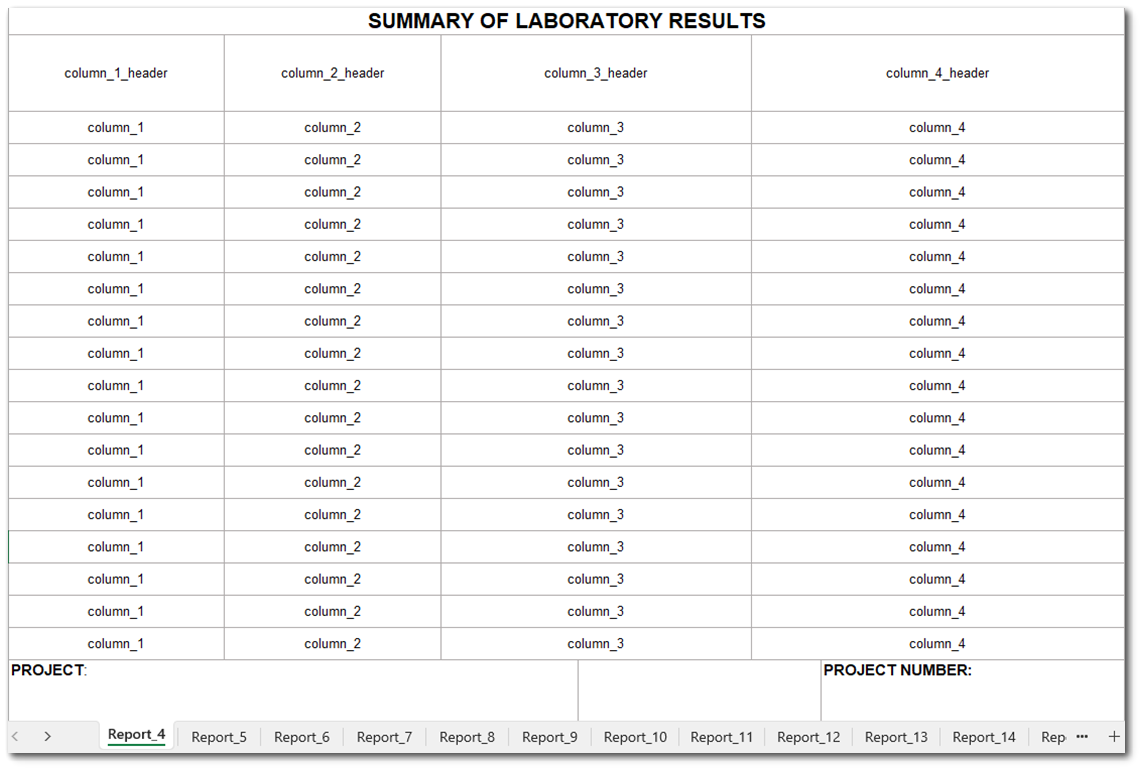
column_n_header where n is any integer starting at 1 |
Column header |
column_n where n is any integer starting at 1 |
Column information |
The screenshot below highlights how these Name Manager fields can be used.
Tables: DT_GEO_CORING, DT_GEO_RESULT, DT_GEO_STANDARD_PENETRATION, DT_GEO_TEST, DT_LOCATION, DT_SAMPLE, DT_TASK, RT_REMAP, RT_REMAP_DETAIL
Report Parameters |
||||||||||||||||||||||||||||||
|---|---|---|---|---|---|---|---|---|---|---|---|---|---|---|---|---|---|---|---|---|---|---|---|---|---|---|---|---|---|---|
|
1Excel report output requires a valid license of Microsoft Excel to view the output.
“Display Formatted Data” Parameter Configuration
The Display Formatted Data parameter allows administrators to limit the options displayed to the user when they run the Lab Summary Report. It also gives administrators the ability to customize the header caption for certain fields.
To use the Display Formatted Data parameter in the Lab Summary report, the RT_REMAP and RT_REMAP_DETAIL tables must be configured. The Geotech_Refvals_EDD.xlsx file is setup to load the needed values to the tables (see the Geotech Database Configuration article for details). To manually configure these tables, follow the steps outlined below.
1.Add a row to the RT_REMAP table where RT_REMAP.REMAP_CODE = 'Lab_Summary_Report'.
2.Add a row to the RT_REMAP_DETAIL table for each Formatted Data Parameter.
a.EXTERNAL_FIELD should be:
•‘location_information’ for any items which would be selected from Display Raw Data\Location Information.
•'sample_information' for any items which would be selected from Display Raw Data\Sample Information.
•'std_pen_information' for any items which would be selected from Display Raw Data\Standard Penetration Information.
•'coring_information' for any items which would be selected from Display Raw Data\Coring Information.
•'test_result_information' for any items which would be selected from Display Raw Data\Test-Result Information.
•'calculated_information' for any items which would be selected from Display Raw Data\Calculated Information. Please see the table below for avaliable INTERNAL_VALUE field values to be used with the 'calculated_information' EXTERNAL_FIELD value.
b.EXTERNAL_VALUE should be the header text the user would like to display on the report output.
c.INTERNAL_VALUE for the 'location_information, 'sample_information', 'std_pen_information', 'coring_information', and 'test_result_information' should be the text displayed in the corresponding Display Raw Data Parameter Field column. For the 'calculated_information', refer to the table below for the correct INTERNAL_VALUE to use.
d.REMAP_CODE should be ‘Lab_Summary_Report’.
e.REMARK should be the order users would like columns to display in the report output.
Warning: The EXTERNAL_FIELD and INTERNAL_VALUE values are case sensitive. |
Field Caption in Calculated_Information |
Corresponding INTERNAL_VALUE to be used |
|---|---|
CS Symbol |
uscs_symbol |
USCS Description |
uscs_desc |
USCS Classification |
uscs_desc_symbol |
% Sand (ASTM D422) |
sand |
% Cobbles (ASTM D422) |
cobbles |
% Gravel (ASTM D422) |
gravel |
% Clay (ASTM D422) |
clay |
% Fines (ASTM D422) |
fines |
% Silt (ASTM D422) |
silt |
% Clay (ASTM D7928) |
hyd7928_clay |
% Silt (ASTM D7928) |
hyd7928_silt |
LL |
ll |
PL |
pl |
PI |
pi |
AASHTO Classification |
aashto_classification |
% Coarse Material (AASHTO T-88) |
aashto_coarsematerial |
% Sand (AASHTO T-88) |
aashto_sand |
% Fines (AASHTO T-88) |
aashto_fines |
% Silt (AASHTO T-88) |
aashto_silt |
% Clay (AASHTO T-88) |
aashto_clay |
USDA Classification |
usda_classification |
% Sand (USDA) |
usda_sand |
% Silt (USDA) |
usda_silt |
% Clay (USDA) |
usda_clay |
Depth |
depth |
Water Content |
water_content |
Wet Density |
wet_density |
Dry Density |
dry_density |
Unconfined Compressive Strength |
uc_strength |
Unconsolidated Undrained Strength |
uu_strength |
Examples:
If a user wanted to display the sample depth as “Sample Depth”, set the following:
•EXTERNAL_FIELD = 'sample_information'
•EXTERNAL_VALUE = ‘Sample Depth’
•INTERNAL_VALUE = 'start_depth'
If a user wanted to display the Atterberg Liquid Limit as “Atterberg Liquid Limit”, set the following:
•EXTERNAL_FIELD = 'test_result_information'
•EXTERNAL_VALUE = ‘Atterberg Liquid Limit’
•INTERNAL_VALUE ='Atterberg:- Att_LL'