Use the Map Widget to:
•Display multi-layered map with facility locations;
•View map and features in three dimensions (3D);
•Interact directly with features on the map, such as clicking on the map to view additional information;
•Interact with other reporting widgets;
•Display report output on the map;
•Display georeferenced documents and photographs on the map; and
•Measure distance and/or area on the map.
The Map widget allows the user to display a map using Esri ArcGIS Maps SDK for JavaScript. Please review the ArcGIS Maps SDK for JavaScript licensing information and the Esri ArcGIS Maps SDK for JavaScript system requirements before using this widget.
Data Requirements
In addition to the coordinate data stored in the DT_COORDINATE table, the following fields need to be populated for the Map widget to correctly display locations:
•RT_COORD_TYPE.COORD_TYPE_CODE
•RT_COORD_TYPE.SRID
•RT_COORD_TYPE.STATUS_FLAG (must be set to "A")
•DT_FACILITY.COORD_TYPE_CODE
•DT_FACILITY.IDENTIFIER
•DT_COORDINATE.COORD_TYPE_CODE
•DT_COORDINATE.IDENTIFIER
The SRID in the RT_COORD_TYPE table needs to be populated with the value of the Well-known ID (WKID). In Esri GIS, projected and geographic coordinate systems are defined by a WKID (or a definition string (WKT)). See the reference here:
https://developers.arcgis.com/javascript/jsapi/spatialreference-amd.html.
Widget Interface
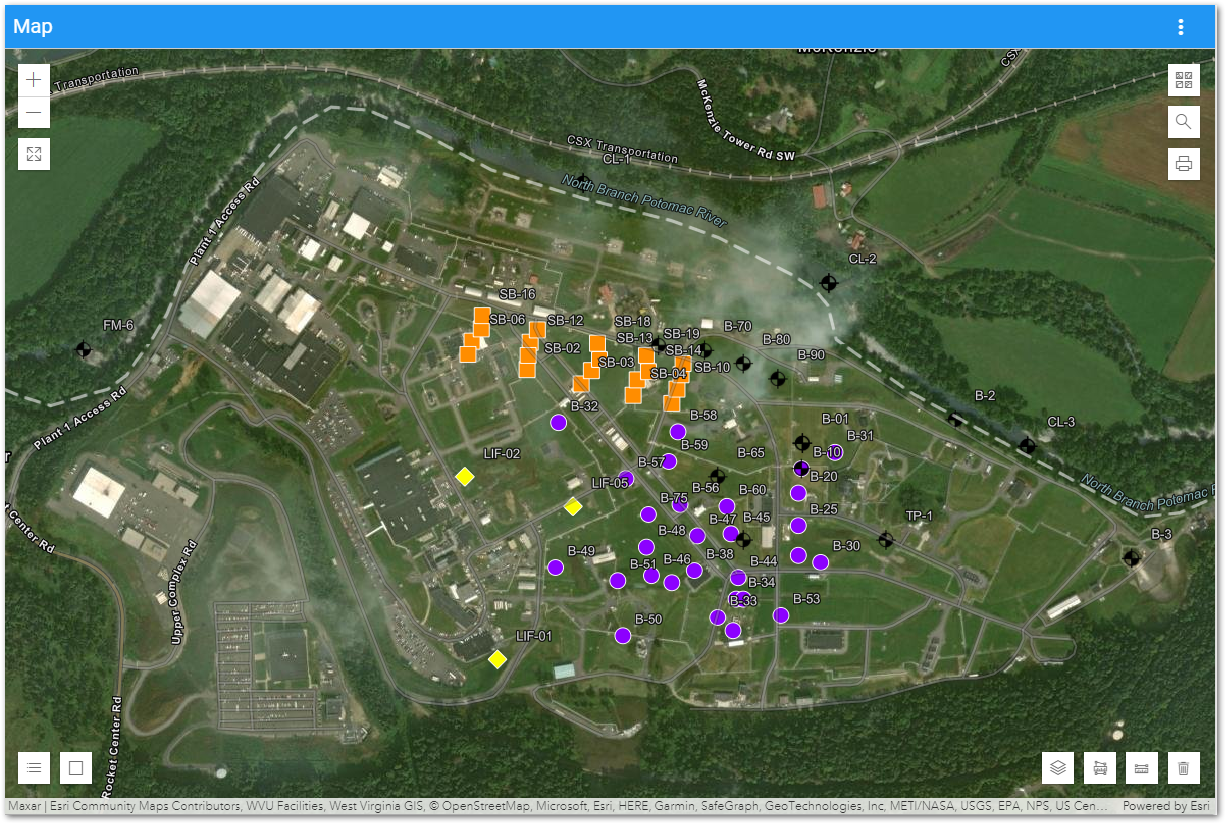
The widget displays a multi-layered map with facility locations (as defined in VW_LOCATION), report output, and other map layers. By default, the Map widget displays layers in two dimensions (2D), but users can enable an option to display the map layers in 3D (see section below for more details).
Note: The Map widget will convert elevation units to: •DT_FACILITY.ELEV_UNIT, •DT_LOCATION.UNITS, or •DT_COORDINATE.ELEV_UNIT. The first non-null value will be selected from this list. |
|---|
Map Controls
The Map widget has the following user interface functions that can be enabled/disabled on the User Interface tab in the Widget Editor:
•Zoom In and Zoom Out – Although the default view extents for the map can be set, the user can always change how much of the map is displayed. Click either the Zoom In (![]() ) or Zoom Out (
) or Zoom Out (![]() ) buttons to view the page as needed. These buttons are located on the top-left of the widget. Users can also zoom in and out by using the scroll button on the mouse.
) buttons to view the page as needed. These buttons are located on the top-left of the widget. Users can also zoom in and out by using the scroll button on the mouse.
•Fullscreen – Click the Enter Fullscreen ![]() button to expand the map to the extent of the user's screen. Selecting the Exit Fullscreen
button to expand the map to the extent of the user's screen. Selecting the Exit Fullscreen ![]() button, hitting escape on the keyboard, or hitting F11 on the keyboard will exit full screen and return to the dashboard.
button, hitting escape on the keyboard, or hitting F11 on the keyboard will exit full screen and return to the dashboard.
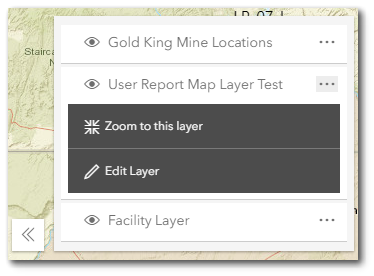
•Layer List – Select the Expand the Layer List ![]() button to display a list of layers and sub-layers added to the map. Layers can be toggled on and off by selecting the View
button to display a list of layers and sub-layers added to the map. Layers can be toggled on and off by selecting the View ![]() icon for the layer. Click the Open
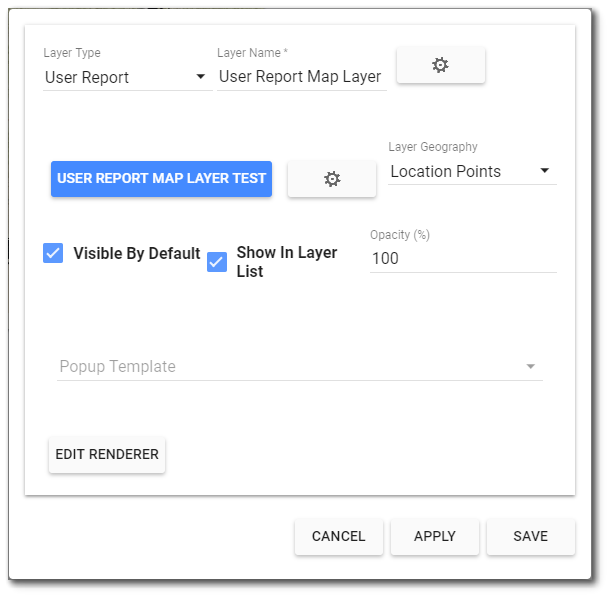
icon for the layer. Click the Open ![]() icon for a layer to display a menu that allows zooming to the layer or editing the layer. Selecting Edit Layer will display an editing window that allows users to edit the layer without having to open the Widget Editor. Users can apply the changes in the current window or save them to persist next time the widget is opened. Click on the Collapse
icon for a layer to display a menu that allows zooming to the layer or editing the layer. Selecting Edit Layer will display an editing window that allows users to edit the layer without having to open the Widget Editor. Users can apply the changes in the current window or save them to persist next time the widget is opened. Click on the Collapse ![]() icon to close the drop-down menu.
icon to close the drop-down menu.
|
|
|---|
•Basemap Gallery – A variety of map types are available within Enterprise. Select the Basemap Gallery ![]() button to open the drop-down selection of map types. The current options are ArcGIS defaults types. Click on the Collapse
button to open the drop-down selection of map types. The current options are ArcGIS defaults types. Click on the Collapse![]() icon to close the drop-down menu.
icon to close the drop-down menu.
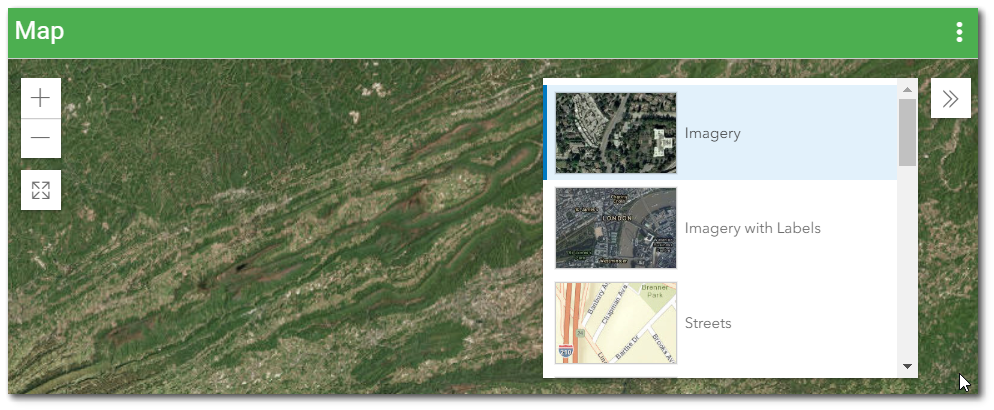
The default basemaps are stored in the ST_CONFIG table. Acceptable entries for the default basemaps can be found at ESRI's ArcGIS Maps SDK JavaScript article. Additional information can be found at the Default Basemap article.
•Search – The Search functionality is disabled by default and can be enabled by selecting the "Enabled" check box on the User Interface tab in the Map Widget Editor. The Search ![]() option allows the user to search for geographic locations (e.g., address) on the map. This option does not search for EQuIS data. Click on the Collapse
option allows the user to search for geographic locations (e.g., address) on the map. This option does not search for EQuIS data. Click on the Collapse![]() icon to close the search box.
icon to close the search box.
•Print – Users can print (export) the current Map widget display and extents. Only visible layers will be included. The print functionality is disabled by default and can be enabled by selecting the "Enabled" check box on the User Interface tab in the Map Widget Editor. The print functionality uses Esri's PrintingTools service hosted on ArcGIS Online. The supported output formats from the PrintingTools service are PDF, PNG32, PNG8, JPG, GIF, EPS, SVG, SVGZ, TIFF and AIX.
Select the Print ![]() button to view a drop-down list of exporting options for a page Layout or Map Only. The Layout tab can be used to include additional information, such as a title, legend, etc. The scale can be set using either tab.
button to view a drop-down list of exporting options for a page Layout or Map Only. The Layout tab can be used to include additional information, such as a title, legend, etc. The scale can be set using either tab.
|
|
|---|
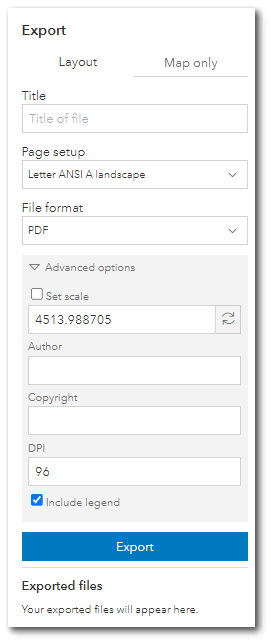
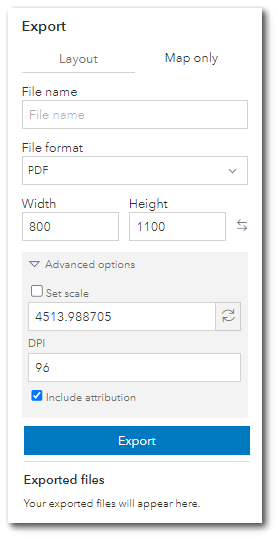
Click the Export button after all options are set to generate the designated file. The exported file will be displayed beneath the Export button. Click on the file to open the file from Esri's server in a browser window. Download or save the file from the browser.
Click on the Collapse![]() icon to close the drop-down menu in the Map widget.
icon to close the drop-down menu in the Map widget.
•Legend – When a layer is added to the map, the Legend![]() button can be selected to view a drop-down list of map symbols. Click on the Collapse
button can be selected to view a drop-down list of map symbols. Click on the Collapse![]() icon to close the drop-down menu.
icon to close the drop-down menu.
•Sketch – The Sketch feature enables group selection of facility locations to filter the report output of reporting widgets (e.g., EZView, Traffic Light, Traffic Light Map, Time Series Chart, Map, Boring Log, and Data Grid) on the dashboard to the selected locations. Click the Expand the Sketch![]() button, then click the Expand
button, then click the Expand![]() icon to display the area selection tools
icon to display the area selection tools ![]() (Polygon, Rectangle, and Circle). These area selection tools enable group selection of facility locations.
(Polygon, Rectangle, and Circle). These area selection tools enable group selection of facility locations.
Note: While the Sketch option is enabled, the Map widget will not use other filtering features on the dashboard. |
The following example shows an area selected with the Rectangle selection tool:
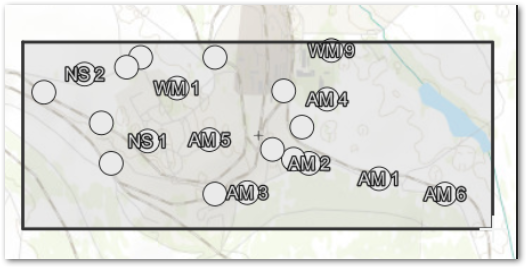
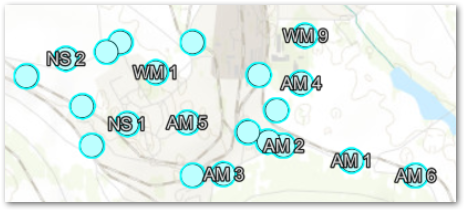
After completing the selection, the rectangle outline will disappear and each selected location will be highlighted with a blue color. Filterable widgets on the dashboard will contain only report results that match the locations selected in the Map widget.
To clear all selections, click the More Options ![]() icon of the Map Widget and select Refresh.
icon of the Map Widget and select Refresh.
•Add Location – This feature allows the user to add a location to a facility by interactively clicking on the Map widget. The Add Location functionality is disabled by default and can be enabled by selecting the "Enabled" check box on the User Interface tab in the Map Widget Editor.
Note: To be able to add a location, the ‘Show Facility Layer’ option must be checked on the General tab in the Widget Editor and selecting a widget facility or session facility is required. If a facility is configured in the widget, then it will be used as facility for the new location, else the session facility will be used. |
Click the Draw a point ![]() icon and then click the desired location on the map.
icon and then click the desired location on the map.
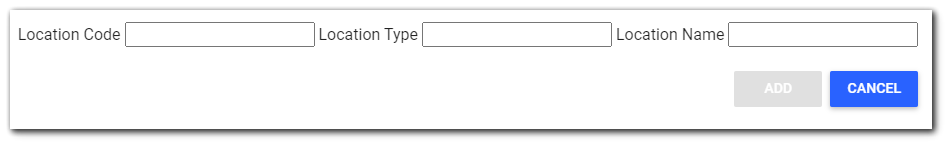
A dialog window will open with the following options:
•Facility dropdown
•Location Code (SYS_LOC_CODE) Required – Coordinates of the location are retrieved from the map and saved to the database.
•Location Type (LOC_TYPE)
•Location Name (LOC_NAME)
The location information is saved in the database as follows:
DT_LOCATION Table
FACILITY_ID = The widget or session facility ID
SYS_LOC_CODE = User input
LOC_NAME = User input
LOC_TYPE = User input
STATUS_FLAG= ‘A’ (Default value)
WORKFLOW_STATUS =’NONE’ (Default value)
DT_COORDINATE
FACILITY_ID = The widget or session facility ID
SYS_LOC_CODE = User input
COORD_TYPE_CODE = ’LAT LONG’
X_COORD = Longitude value trimmed to 10 decimal places
Y_COORD = Latitude value trimmed to 10 decimal places
IDENTIFIER = 'PRIMARY'
Note: Locations added via the Map widget will only be added to the DT_COORDINATE table when the DT_FACILITY.COORD_TYPE_CODE is LAT LONG. |
•Area Measurement – The area measurement option allows the user to delineate a polygon on the map and measure the area and perimeter in various spatial units. Click the Area Measurement ![]() icon to begin delineating the polygon and open the measurement dialog box. Select the unit drop-down menu to change units. The area and perimeter measurements will automatically update. This option does not add data to EQuIS.
icon to begin delineating the polygon and open the measurement dialog box. Select the unit drop-down menu to change units. The area and perimeter measurements will automatically update. This option does not add data to EQuIS.

Click on the Collapse![]() icon to close the measurement box. Click on the Clear
icon to close the measurement box. Click on the Clear ![]() icon to remove the user-generated polygon from the map. The area measurement functionality is disabled by default and can be enabled selecting the "Enabled" check box on the User Interface tab in the Map Widget Editor.
icon to remove the user-generated polygon from the map. The area measurement functionality is disabled by default and can be enabled selecting the "Enabled" check box on the User Interface tab in the Map Widget Editor.
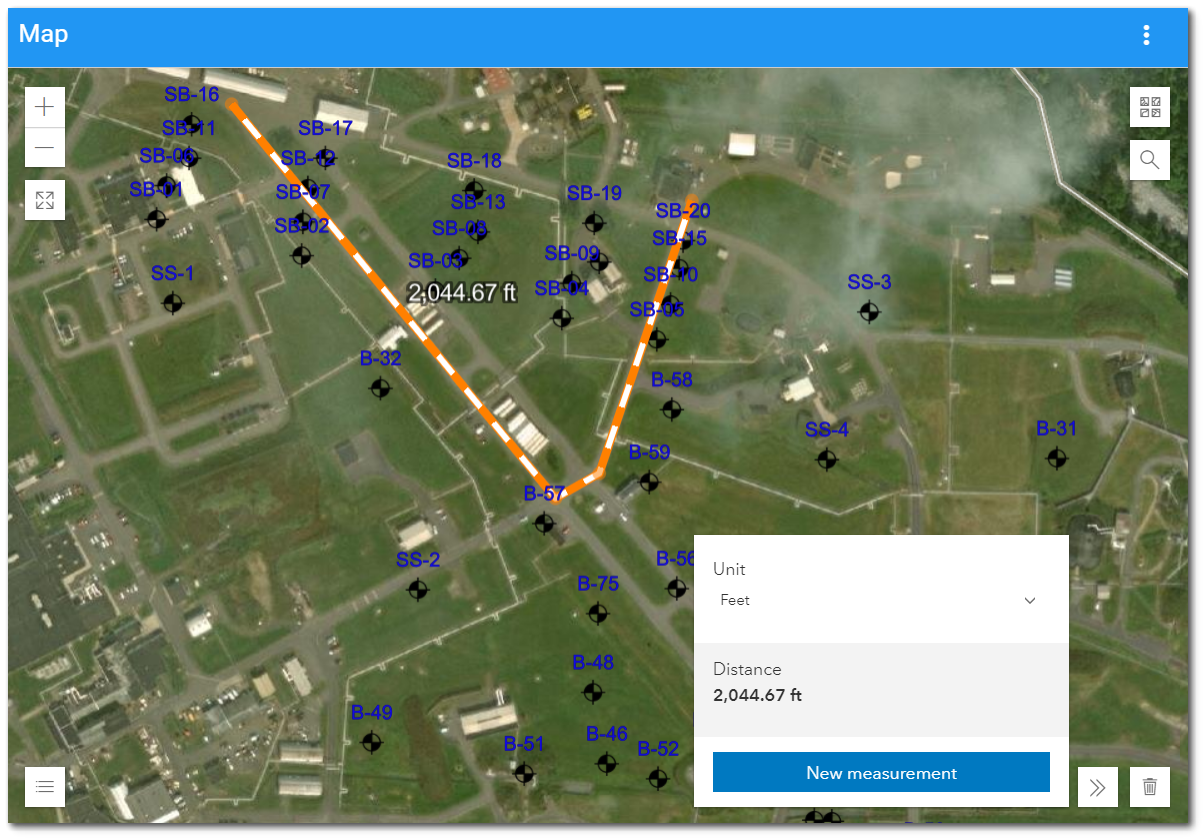
•Distance Measurement – The distance measurement option allows the user to delineate a line on the map and measure the distance in various spatial units. Click the Distance Measurement ![]() icon to begin delineating the line and open the measurement dialog box. Select the unit drop-down menu to change units. The distance measurements will automatically update. This option does not add data to EQuIS.
icon to begin delineating the line and open the measurement dialog box. Select the unit drop-down menu to change units. The distance measurements will automatically update. This option does not add data to EQuIS.
Click on the Collapse![]() icon to close the measurement box. Click on the Clear
icon to close the measurement box. Click on the Clear ![]() icon to remove the user-generated line from the map. The distance measurement functionality is disabled by default and can be enabled selecting the "Enabled" check box on the User Interface tab in the Map Widget Editor.
icon to remove the user-generated line from the map. The distance measurement functionality is disabled by default and can be enabled selecting the "Enabled" check box on the User Interface tab in the Map Widget Editor.
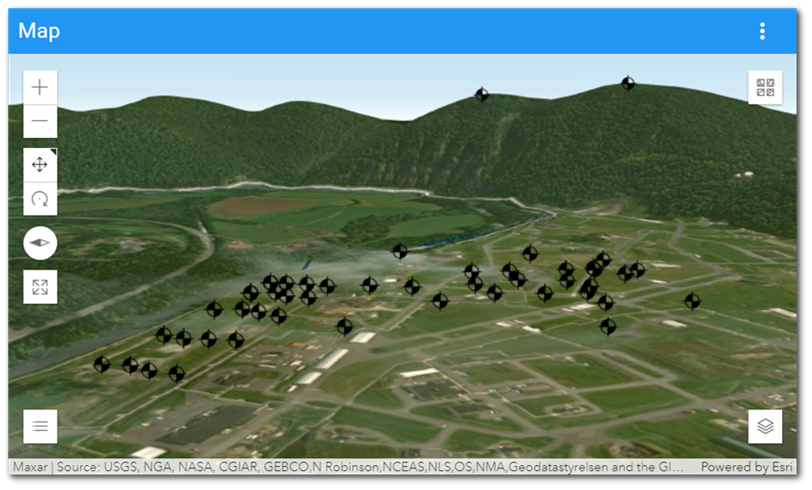
3D Map Option
Users can select a "Use 3D" option on the General tab in the Widget Editor to display the map layers in 3D. When checked, the map will render in 3D and additional tools are available on the map to allow different view perspectives by panning and rotating. For layers that include Z coordinate data, features may be rendered above or below the map’s surface. It is possible to rotate the map view to see sub-surface features.
When the "Use 3D" option is checked, the following additional controls display on the map:
•Toggle to Pan or Rotate in 3D – Click the Pan ![]() button to move the map horizontally and vertically without changing the extent or the compass orientation. Click the Rotate
button to move the map horizontally and vertically without changing the extent or the compass orientation. Click the Rotate ![]() button to adjust the angle and compass orientation of the map view.
button to adjust the angle and compass orientation of the map view.
• Reset Compass Orientation – Click on the Reset Compass Orientation ![]() button to reset the compass orientation to point north.
button to reset the compass orientation to point north.
Popups
Popups can be defined to display when a user selects a location on the map. The Popup Window can display data, images, charts, crosstabs, and other information.
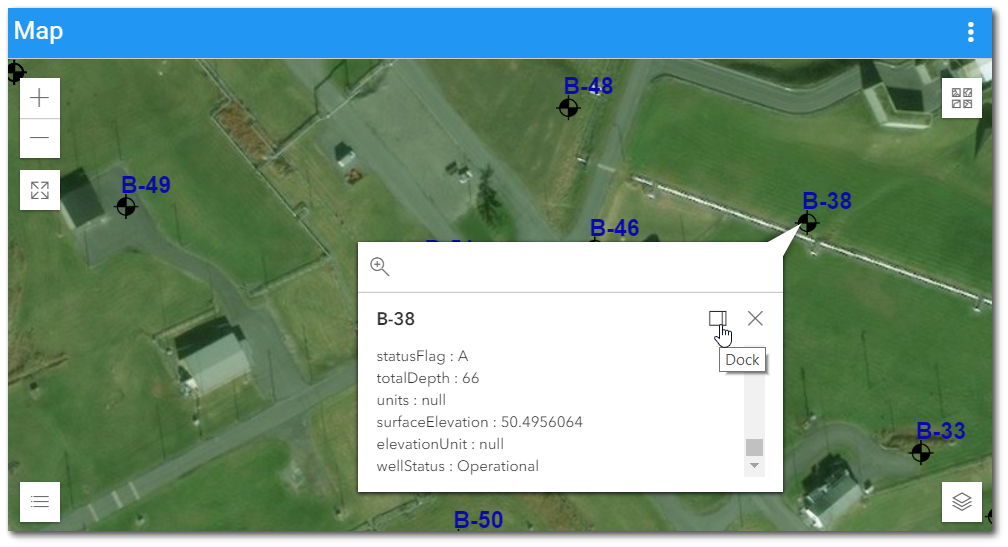
By default, the Popup Window has a leader to the selected location, however, it can be docked to the frame of the Map widget by selecting the Dock icon in the Popup Window. Once the Popup Window is docked, clicking on any other location will populate the Popup Window for that location. Select the Undock icon to undock the Popup Window or the Close icon to close the Popup Window.
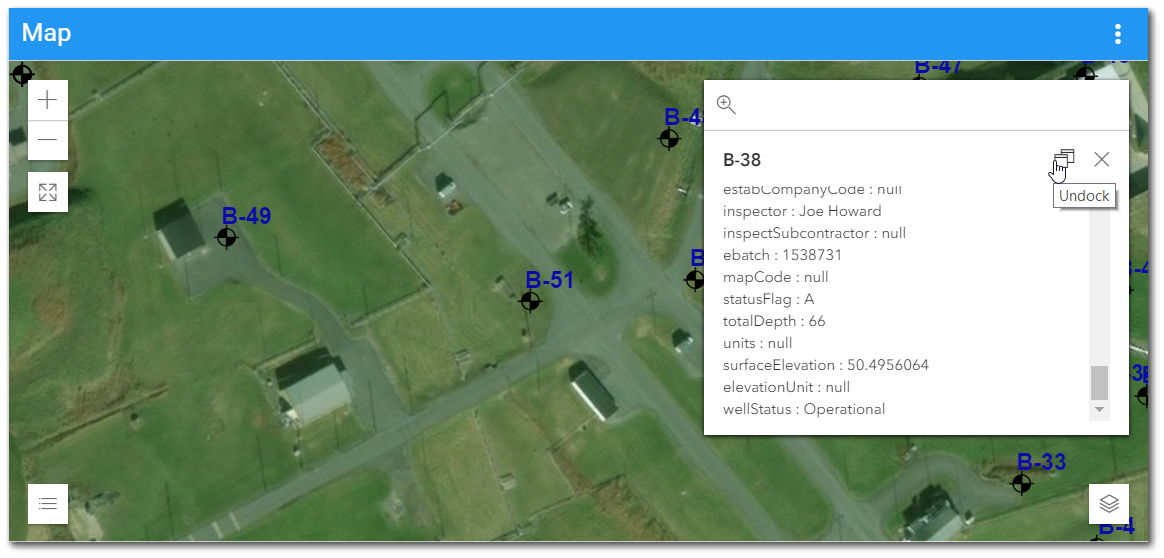
Image files (e.g., PNG, JPG, GIF, SVG) associated with a location will display as a thumbnail in the Map Widget Popup Window. Image files can be associated to a location and uploaded via the Explorer widget. See the Uploading Files article.
Interaction with Other Widgets and Filters
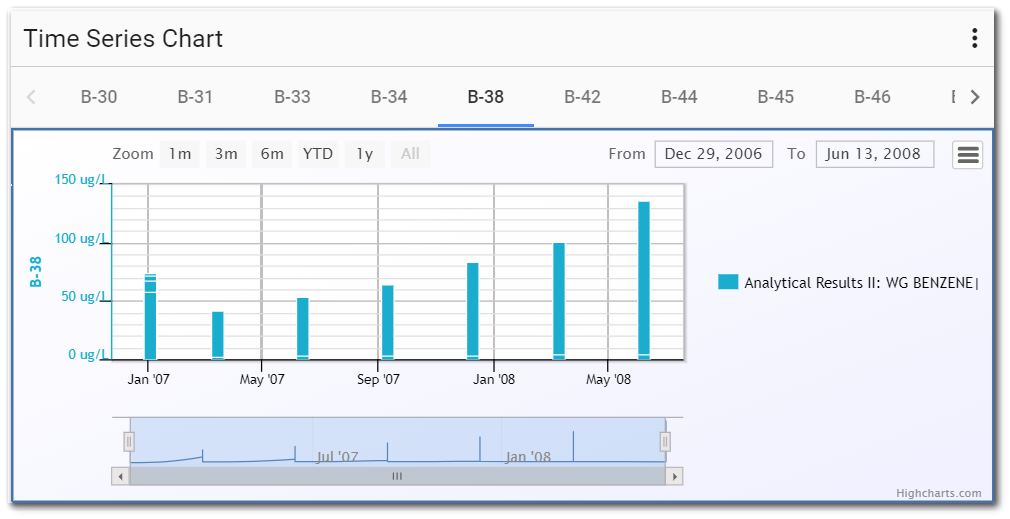
When a location on the Map widget is selected and the Time Series Chart widget is setup to separate charts by SYS_LOC_CODE, the time series chart will automatically adjust to the selected location.
|
|
|---|
The Map widget allows the EZView widget to add a report layer onto the map. Users can drag and drop a valid (mappable) report from the EZView widget to a Map widget by dragging the report name from the EZView widget onto the map. The map will zoom to the extent of the report and display points for the report locations. This report layer will appear until the widget is refreshed.
The Dashboard Filter widgets allow the user to select a parameter value and filter the report output of reporting widgets (e.g., Map widget) on the dashboard. When the Filter-List widget filters on Location, the Map widget will display only the filtered locations or location groups. This function only works for report layers and does not apply to the facility layer.
Note: Due to the asynchronous nature of filtering and layer loading within the Map widget, the Map widget may create duplicates of layers if a user filters the dashboard quickly and does not allow the Map widget to finish loading. Users who experience this issue can fix it by simple refreshing the Map widget after filtering. |
|---|
Widget Properties
Use the Widget Editor to change the properties of the Map widget. The widget properties are divided into six tabs (General, Layers, Labels, Symbology, Extents, and User Interface) in the Widget Editor and are each described in separate help articles.