•Plus
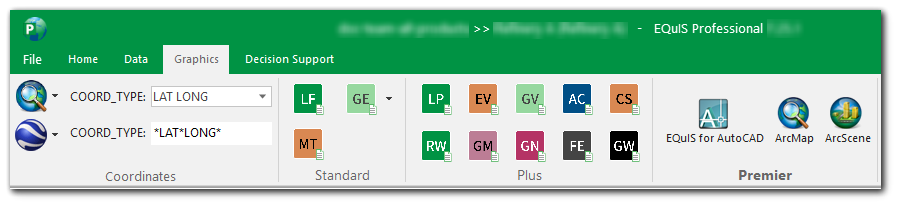
The Graphics ribbon contains a variety of graphics interfaces for creating models with EQuIS data such as Rockworks, GMS, ArcMap, LogPlot, EVS, and Google Earth. The buttons can be activated by making selections in the License Chooser.
For more information on the Coordinates section of the Graphics ribbon, see VW_LOCATION Toolbar.
Leapfrog – Analysis and visualization software |
|
Minitab – Launches the Minitab-Grain Size Distribution Report, which requires the Geotechnical Schema to run |
|
Google Earth Reports – These reports are also available to open in the Reports Open Window |
|
LogPlot – Log plotting software |
|
EQuIS for EVS – Environmental Visualization System (EVS-Pro) software |
|
EQuIS for Groundwater Vistas – Groundwater flow and transport modeling software |
|
AquaChem – Software for aqueous geochemical analysis, plotting, and modeling |
|
EQuIS for CARStat – Software for compliance, assessment, and remediation statistics |
|
EQuIS for RockWorks – Desktop tool used for creating Fence diagrams, 3D Plume Models and much more |
|
EQuIS for GMS – Groundwater Modeling System |
|
EQuIS for gINT – Software to create borehole logs, fence diagrams, reports, and tables |
|
FEFLOW – Finite Element subsurface FLOW system |
|
GWSDAT – Groundwater Spatiotemporal Data Analysis Tool (GWSDAT) |
|
|
|
|
|
ArcScene |