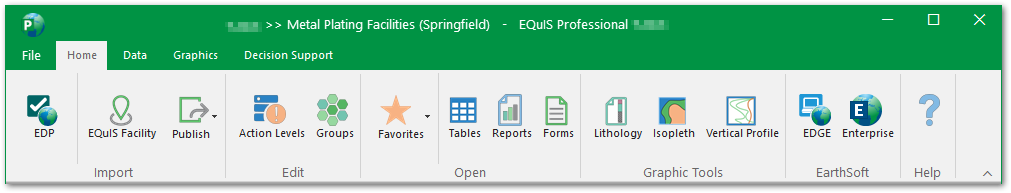
The Home Ribbon is the main landing spot when logging into EQuIS Professional. The ribbon sections include Import, Edit, Open, Graphic Tools, and other EarthSoft products.
Click the buttons above to go to the corresponding documentation page.
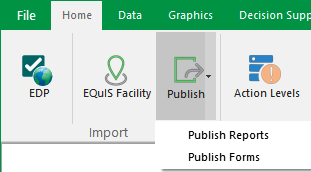
Import Section
The import tool used to check and import data into EQuIS Professional, using Electronic Data Deliverables (EDDs). The user can open EDP without recalling the last used format by holding CTRL and clicking on EDP. The user can open up EDP Express by holding Shift and clicking on EDP. |
|
The EQuIS Migration Wizard tool allows the user to connect to a database, create a new facility, and import reference values and/or data tables to the new facility. |
|
Publish |
Publish options allow the user to publish reports or forms to the database. |
Edit Section
The Action Level form allows users to create, copy, delete, and define action levels. |
|
The Group Maintenance form allows users to create, edit, and delete different groups, such as Facility Groups, Analyte Groups, Location Groups, and Material Groups. |
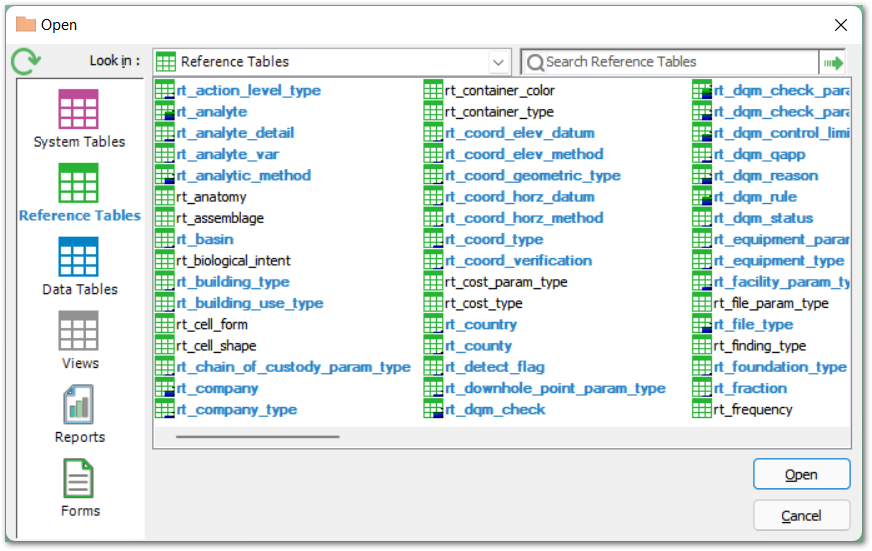
Open Section
The EQuIS Professional Favorites menu allows users to open favorite items. |
|
Launches the Open window to the Data Tables section, showing the data tables within the EQuIS Database, such as DT_FACILITY. |
|
Launches the Open window to the Reports section, showing the reports published to the EQuIS Database as well as active reports and report *.DLL files found in the EQuIS Professional installation directory. |
|
Launches the Open window to the Forms section, showing the forms available in EQuIS Professional, such as the Facility Form for creating a new facility. |
Within the Open window, users can also access the following options:
•Reference Tables, such as RT_UNIT
•System Tables, such as ST_USER_REPORT
•Views, such as VW_LOCATION
Graphic Tools Section
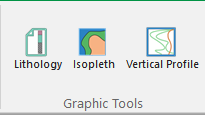
Creates a graphical representation of the lithology for a particular Location ID (select in Options pane) within the Facility currently logged into. |
|
Creates a three-variable graph in which the horizontal axis is time, the vertical axis is depth/elevation, and the body of the graph displays the value of a given parameter. |
|
Creates a vertical trend or line chart that displays one or more parameters at a specified location and time. |