Lithology charts can still be created using TeeCharts in EQuIS Professional 7 by holding down the Shift key on the keyboard while clicking the Lithology ![]() button, which is located within the Tools group of the Home tab on the EQuIS Professional ribbon.
button, which is located within the Tools group of the Home tab on the EQuIS Professional ribbon.
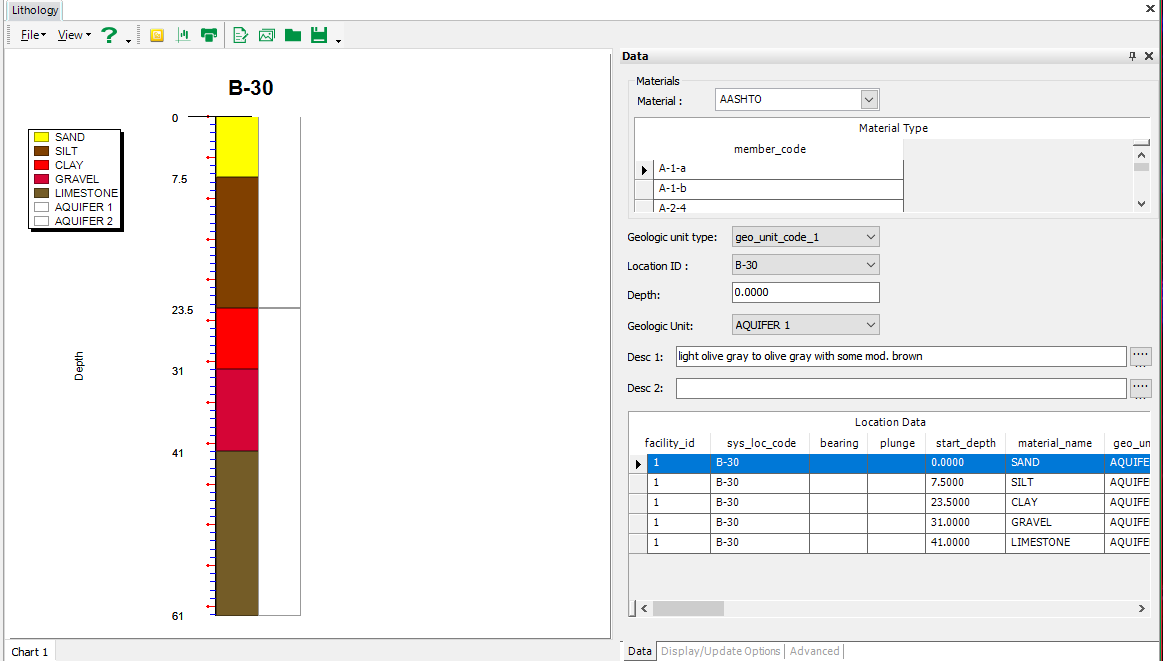
The Lithology window is divided into a left Chart pane and a right Data pane. The Chart pane shows a graphical representation of the lithology for a particular Location ID (selected in the Data pane) for the active Facility. Between the three tabs of the Data pane (Data, Display/Update Options, and Advanced), users can select various options, including entering custom descriptions for each location, adding well screens, toggling between showing depths or elevations, and changing the chart size.
From the top toolbar, users can choose to export the chart as a .jpg file, save it as a template, print it or add annotations or other graphics to it.