Note: Topics under the Lithology section are created for Lithology generated using Syncfusion Window Form Chart tools, which replaces Lithology generated with TeeChart starting in EQuIS Professional 7. For documentation on the legacy Lithology, refer to the help article Lithology (TeeChart). |
The Lithology feature visualizes soil/rock materials along depth/elevation with a stacked column chart. It can also display well screens. Note that DT_COORDINATE.ELEV is required to create lithology charts.
Note: When using EQuIS with a non-English language, the Lithology tool may not appear to use the correct decimal separator for certain fields (such as DT_COORDINATE.ELEV), returning conversion error messages such as "Le format de la chaîne d'entrée est incorrect" ("Input string was not in a correct format"). This can occur if many decimal places are present in those fields. The Lithology tool should display the lithology data correctly if users switch to a different location and then back. |
Watch the Office Hour video on Visualization Tools in EQuIS Professional for a demonstration.
Create Lithology Charts
1.Click the Lithology ![]() button located in the Graphic Tools group on the Home ribbon to open the Lithology Chart form.
button located in the Graphic Tools group on the Home ribbon to open the Lithology Chart form.
2.On the Data tab, select a Geologic unit type.
3.Select a Location ID to create the lithology chart of the location (see Lithology Chart form image below).
Note: Whenever Geologic unit type is modified, the Location ID drop-down must be clicked to update the chart. |
Lithology Chart Form
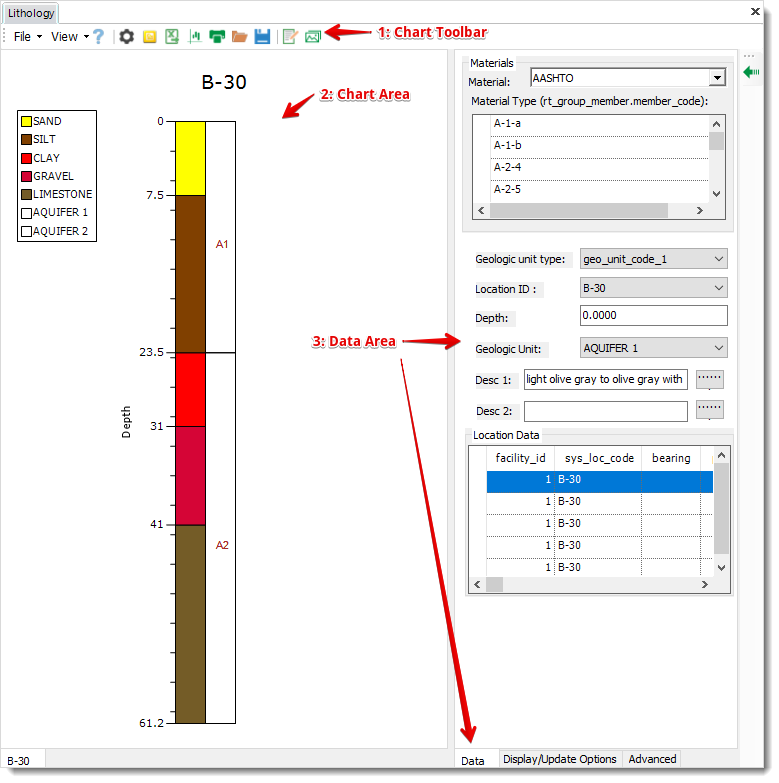
The Lithology Chart form consists of the following components (see image below):
1.Chart Toolbar (similar to the XY Chart toolbar)
2.Chart Area
3.Right pane with the Data Tab, Display/Update Options Tab (see image in Display/Update Options section below) or Advanced Tab
Data Tab
Materials – Displays information related to the chart. The Materials are mapped to RT_GROUP.GROUP_CODE where GROUP_TYPE = 'material_name'. Modify the Material drop-down list selection to change the list of the Material Type, which is mapped to RT_GROUP_MEMBER.MEMBER_CODE.
Geologic unit type – Lists the five field names of the DT_LITHOLOGY table: GEO_UNIT_CODE_1, GEO_UNIT_CODE_2, GEO_UNIT_CODE_3, GEO_UNIT_CODE_4 and GEO_UNIT_CODE_5. After one geologic unit type is selected, selecting a Location ID generates a lithology chart, if the location has lithology data in the DT_LITHOLOGY table.
Location ID – Is mapped to DT_LOCATION.SYS_LOC_CODE. Selecting a Location ID generates a lithology chart, if the location has lithology data in the DT_LITHOLOGY table under the selected Geologic unit type.
Depth – Displays the information related to the chart. Is mapped to DT_LITHOLOGY.START_DEPTH matched to the selected row of the Location Data grid of the Data area.
Geologic Unit – Displays information related to the chart. The value of the selected Geologic unit type is its selected item: of the selected Location ID. The drop-down list contains a distinct list of the values of the GEO_UNIT_CODE_1, GEO_UNIT_CODE_2, GEO_UNIT_CODE_3, GEO_UNIT_CODE_4 and GEO_UNIT_CODE_5 fields of the DT_LITHOLOGY table where SYS_LOC_CODE = the selected Location ID of the current facility.
Desc 1 – Displays information related to the chart. Is mapped to DT_LITHOLOGY.REMARK_1 matched to the selected row of the Location Data grid of the Data area. Click the button to the right of the text box to see the entire REMARK_1 value.
Desc 2 – Displays information related to the chart. Is mapped to DT_LITHOLOGY.REMARK_2 matched to the selected row of the Location Data grid of the Data area. Click the button to the right of the text box to see the entire REMARK_2 value.
Location Data (grid) – Displays information related to the chart. Is mapped to the DT_LITHOLOGY table data for the selected Location ID.
A lithology chart is generated based on the selections of the "Geologic unit type" and "Location ID" in the Data tab. The other items of the Data tab will not affect the chart.
Display/Update Options Tab
The Display/Update Options tab is next to the Data tab. Click to access its content (see image below).

Display Text – Is mapped to the column names of the DT_LITHOLOGY table. When a column of the DT_LITHOLOGY table is selected in the Display Text, its values are displayed within a rectangle on the right side of the chart. For example in the image above, the DT_LITHOLOGY.REMARK_1 values are displayed.
Well Screen – Is mapped to the SEGMENT_TYPE column of the DT_WELL_SEGMENT table where SYS_LOC_CODE = the selected Location ID. When the check box of the Well Screen is checked, the lines from DT_WELL_SEGMENT.START_DEPTH to END_DEPTH with an increment of 1 depth unit are drawn to represent where this selected SEGMENT_TYPE is located (shown in image above).
Well Screen Check Box – Used to turn on or off displaying the SEGMENT_TYPE in the chart.
Depth and Elevation Radio Buttons – Used for controlling the unit of Y-axis.
Location/Lithology Grid – Is used to enter start depth, material name, remark_1 and remark_2 of a location. Users can then save the grid data into the DT_LITHOLOGY table by clicking the Update button after entering a complete set of information.
Note: Only the information of one location can be saved into the DT_LITHOLOGY table for each Update button click. |
Example of Entering Lithology Data into the Grid:
1.Click in the first Location cell of the first row and enter "new loc 1". If the location is not in the DT_LOCATION table, it is added into the table after the Update button is clicked.
2.Press the Tab key to move focus onto the StartDepth cell and enter "0".
3.Press Tab to move to the next cell and enter "new material 1" in the Material Name cell. If the material name is not in the RT_MATERIAL table, it is added into the table after clicking the Update button.
4.Press Tab and enter "r1" in the Remark_1 cell.
5.Press Tab and enter "r2" in the Remark_2 cell.
6.Press Tab to move focus to the StartDepth cell of the next row. Since only one location can be saved when the Update button is clicked, the location name (SYS_LOC_CODE) is always auto-copied to the next new row so users do not have to enter the SYS_LOC_CODE for the rest of the rows. Continue entering data as shown in the image below.
7.Enter "40" into the Total Depth text box, which is mapped to DT_LOCATION.TOTAL_DEPTH and added into the DT_LOCATION table after the Update button is clicked.
8.Enter "200" into the Elevation text box, which is mapped to DT_COORDINATE.ELEV and added into the DT_COORDINATE table after the Update button is clicked. Note that the COORD_TYPE_CODE, IDENTIFIER and ELEV_UNIT, associated to the elevation of the location are obtained from the DT_FACILITY table of the current facility.
9.Click the Update button to save the entered lithology data into the DT_LITHOLOGY table (see image below) after the complete set of lithology information for the location are entered.

Total Depth – Is for users to enter DT_LOCATION.TOTAL_DEPTH.
Elevation – This is for users to enter DT_COORDINATE.ELEV. Note that the associated COORD_TYPE_CODE, IDENTIFIER and ELEV_UNIT of the location are obtained from the DT_FACILITY table of the current facility, when elevation is saved to the DT_COORDINATE table.
Update Button – Click it to save location/lithology, Total Depth and Elevation data into the DT_LITHOLOGY, DT_LOCATION, DT_COORDINATE and RT_MATERIAL tables, if applicable.
Edit Lithology Charts
Click anywhere in the chart area to display the properties of the chart in the Advanced tab for editing.
Example: Make the Title Bold
Find and click Titles > Collection to open the ChartTitle Collection Editor. Extend Font and modify the value of Bold to True in ChartTitle Collection Editor.
Edit a Chart Series
Click the Turn on or off the Chart Editor tool of the chart toolbar, click Edit Style and then select a series to edit. See more details in XY Chart Basics: Chart Editor.
Edit X/Y-Axis
Click the X- or Y-axis area to open 'X axis' or 'Y axis' Properties in the Advanced tab (e.g., modify the value of Title and then press the Enter key, etc.).
Add an Annotation or Image to a Chart
Reference Add Images and Annotations of XY Charts.
Export Lithology Charts
Right-click anywhere in a chart area to open a menu window; select Export Chart, which allows users to change the chart saving path and/or image type, and then save the chart to the computer.
Copy Chart
Right-click anywhere in a chart area to open a menu window. Select Copy Chart to copy the *.bmp-type chart into the computer clipboard. After copying the chart, paste it into a Word document, an Excel spreadsheet, etc.
Email/Save/Print a Chart
Right-click anywhere in a chart area to open a menu window. Select Send To... > Mail Recipient/My Charts/Printer to email the chart, save the chart to ...\My EQuIS Work\Charts\... or open the chart in the printer window of the computer.