The Chart Editor ![]() can be turned on or off by clicking on Turn On/Off Current Chart Editor from the Chart Toolbar. It is used to work on the active chart to Save, Copy, Print, Print Preview, Change Palette, Edit Style, Change Type, Switch 3D Mode and Save/Hide Legend.
can be turned on or off by clicking on Turn On/Off Current Chart Editor from the Chart Toolbar. It is used to work on the active chart to Save, Copy, Print, Print Preview, Change Palette, Edit Style, Change Type, Switch 3D Mode and Save/Hide Legend.
Example 1
Click on Copy chart to copy the active chart to the clipboard. Open a Word (.doc/.docx) file and paste (Ctrl-V) the image file into the Word file.
Example 2
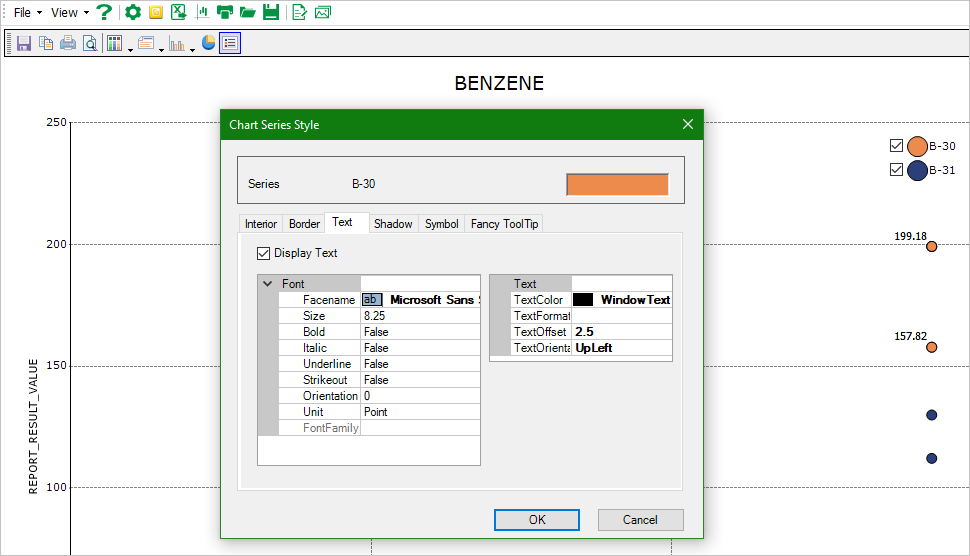
Add labels to data point: click Edit Style in the Chart Editor and select a series which brings up the Chart Series Style window. Select Text, check Display Text, and change TextOrientation to Upleft to add labels to data points of the selected series (Figure 1).

Figure 1
Note: Some formatting may differ when exported to Excel. If formatting updates do not appear within the graph in EQuIS Professional, export to Excel and check that the changes appear there. |