The Data, Advanced, Errors and other XY Chart tabs and buttons are displayed and explained in the Figure below.
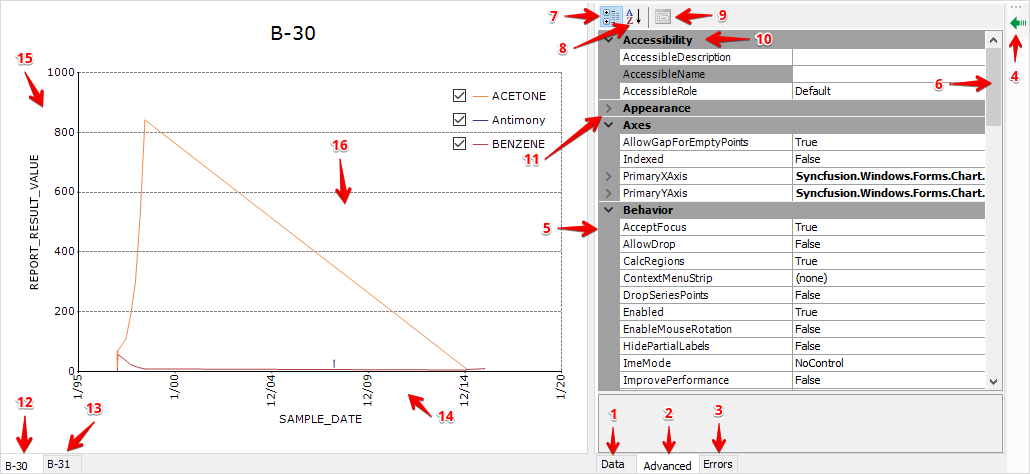
1.Data Tab – See XY Chart Basics: Chart Parameters.
2.Advanced Tab – See View of XY Chart Basics: Chart Toolbar, and notice how View and Advanced work closely with each other. In addition, there are other ways to use the Advanced tab after it is clicked (see Figure above).
a.Click X-axis area (Item 14) to show the properties of X-axis of the active chart in Advanced tab.
b.Click Y-axis area (Item 15) to show the properties of Y-axis in Advanced tab.
c.Click plot area (Item 16) to show the properties of the active chart, which is B-30 (Item 12) in Advanced tab.
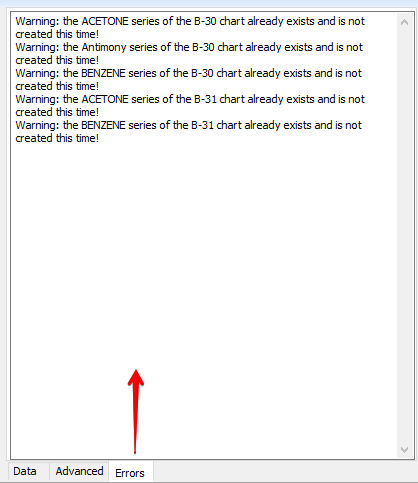
3.Errors Tab – In generating charts (click Add Series), XY Chart may record unexpected issues such as missing data, etc. The suggestion is to click on this tab after charts are generated, to make sure there are no errors. For example, after charts are generated, click Add Series again to try to add the chart series one more time. There will be no changes to the charts, but some warning messages have been written in the Errors tab, as shown below.
4.OpenCloseDataArea Button – Click to hide Data/Advanced/Errors area so that the chart area can be extended.
5.Right pane of Data, Advanced or Errors – The annotated image above displays the interface of the Advanced tab, and displays the properties of the active chart (or axes that depends on an operation associated with the Advanced tab).
6.Scroll Bar – Drag it to scroll the property list (5) down or up.
7.Sorting By Category Button – Click to sort the properties by category.
8.Sort Alphabetically Button – Click to sort the properties alphabetically.
9.This button is not used.
10.Category – The category name of a set of properties.
11.> Toggle – Click to expand the category to show its properties.
12.Chart Tab – The B-30 tab is highlighted with a white color background, so it is the active chart which is shown in the figure.
13.Chart Tab – The B-31 chart is currently hidden.
14.X-axis Area – Click it, then click on the Advanced tab (or the other way around) to show the properties of X-axis in Advanced.
15.Y-axis Area – Click it, then click on the Advanced tab to show the properties of Y-axis in Advanced.
16.Plot Area – Click it, then click on the Advanced tab to show the properties of the active chart in Advanced. If the active chart is at a zoomed status, double-click it to restore to the original active chart.