•File
•View
•Quick Tool Buttons in Chart Toolbar
After running a report and clicking on XY Charts to create charts, the Chart Toolbar (shown below) is displayed above the empty chart area and contains File, View and quick tool buttons.
![]()
File
The following selections are available from the File drop-down:
Load Template – Loads a saved chart template XML file.
Note loading a template may not retrieve all saved properties of a chart. Users are welcome to report issues to EarthSoft so they can be corrected based on needs.
Save Template – Saves the properties of the active chart into a chart template XML file.
Note saving a template may not save all the saved properties of a chart. Users are welcome to report issues to EarthSoft so they can be corrected based on needs.
Recent Templates – Lists currently saved chart template XML files so that users can conveniently select one to load.
Export – Exports all the charts to a user-selected folder as image files.
Send To >
Outlook – Exports active chart to a JPG image file and opens message editing window of outlook.exe (if installed) with the image file attached.
Excel – Exports all the charts to an Excel file. To view the raw data in the Excel chart export, right-click on a worksheet tab and choose Unhide from the context menu; click a worksheet from the list of the hidden "Data" worksheets to unhide it.
My Charts – Exports all the charts as image files to a user-selected folder.
Close – Closes the chart window.
View
The following selections are available from the View drop-down:
Data – Displays or activates the Data tab.
Advanced >
Active Chart – Displays the properties of the active chart in the Advanced tab.
All Charts – Displays the properties of all the charts in the Advanced tab.
All Series – Displays the properties of all the series of all the charts in the Advanced tab.
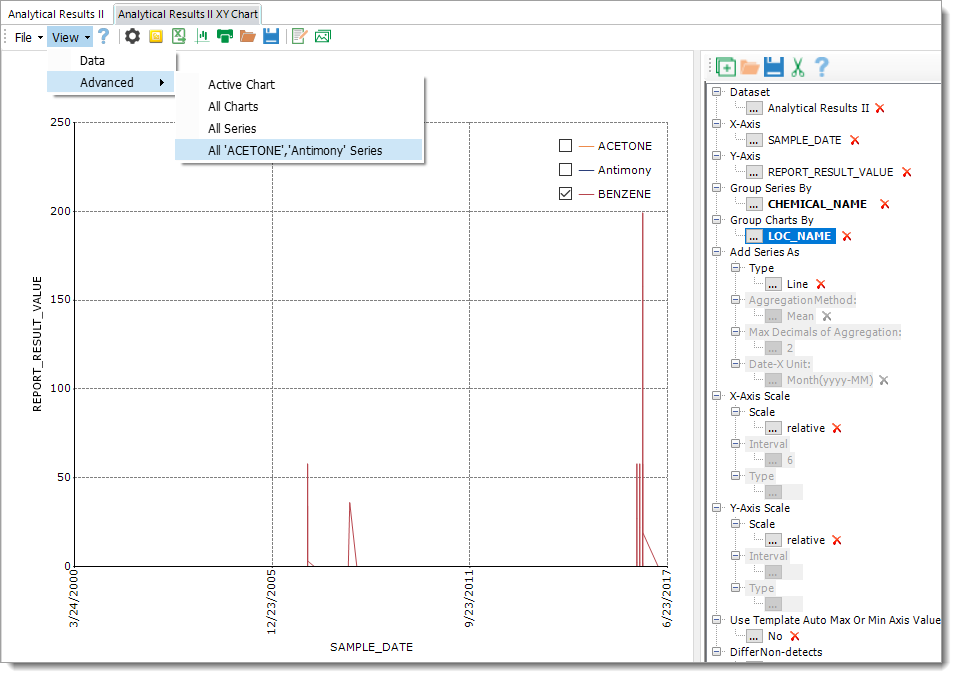
All '{0}' Series – Displays the properties of the selected series of all the charts in the Advanced tab. Note deselect one or more series legends and click on View > Advanced > All '...' Series, which reselects the deselected series and displays the properties of the selected series of all the charts in Advanced tab (see the two images below).
Once some of the chart series are selected/displayed in All '...' Series, they are remembered there until the charts are cleaned by doing Clear Series. Because of this feature, users can reverse the changes done to the series of All '...' Series sometime later by re-selecting All '...' Series.
Warning: When one of the View > Advanced > items is selected, do not click on the chart area until editing the properties in the Advanced tab is completed. For example, if a user clicks on the center of the chart area, axes area or chart name tab etc., the Advanced tab may no longer display what was selected over the View > Advanced >. |
Example 1 of use All '{0}' Series: See Combine Multiple Reports in XY Chart or Setup Secondary Y Axis
Example 2 of use All '{0}' Series: See Remove Series From Charts
The image below shows how to Do All '{0}' Series. First deselect ACETONE and Antimony Series of all the charts. Next, select View > Advanced > All "..." Series.
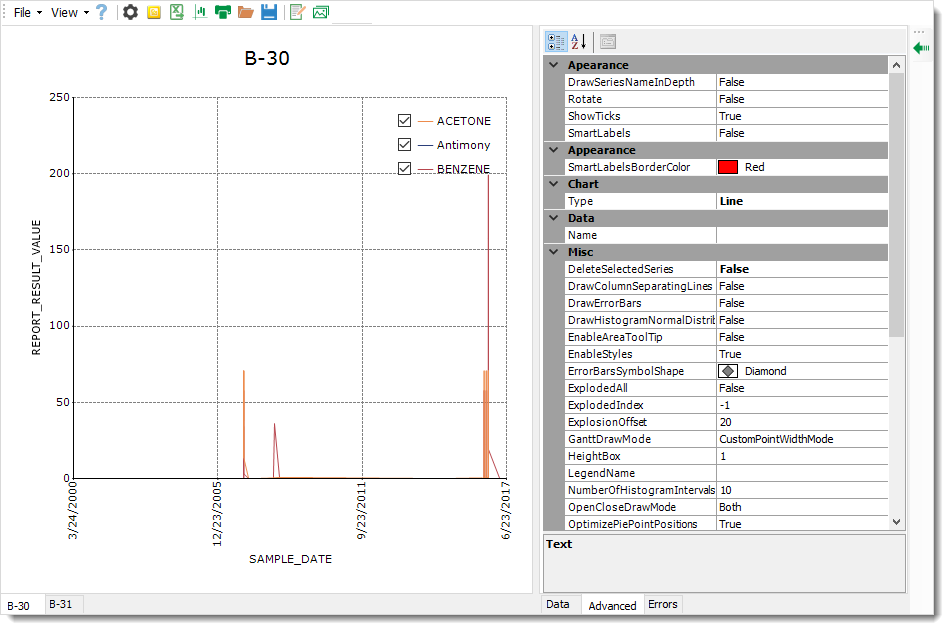
The image below shows how to Do All '{0}' Series. After clicking All '...' Series, deselected series are reselected, and the properties are in the Advanced tab. Changes in the Advanced tab apply to all charts.
Quick Tool Buttons in Chart Toolbar
Turn On/Off Current Chart Editor – Turns the Chart Editor for the active chart on or off. See details in XY Chart Basics: Chart Editor.
Send the current chart to an email – Exports the active chart to a JPG image file, and opens the message editing window of outlook.exe (if installed) with the image file attached.
Send To Excel – Exports all the charts to an Excel file. To view the raw data in the Excel chart export, right-click on a worksheet tab and choose Unhide from the context menu; click a worksheet from the list of the hidden "Data" worksheets to unhide it.
Send To My Charts – Exports all the charts as image files to an auto-generated folder.
Print – Exports all the charts as image files to the newly created ... \My EQuIS Work\...\ (Chartsyyyy-MM-dd hhmmss) folder and opens the files with a default picture viewer associated to the image type so users can print after reviewing the images.
Load Template – Loads a saved chart template XML file.
Note loading a template may not retrieve all the saved properties of a chart and users are welcome to report issues to EarthSoft so that they can be corrected based on needs.
Save Template – Saves the properties of the active chart into a chart template XML file.
Note that saving a template may not save all the saved properties of a chart and users are welcome to report issues to EarthSoft so that they can be corrected based on needs.
Add Annotation – Adds annotations to the active chart. See details in Add Images and Annotations.
Add Image – Adds images to the active chart. See details in Add Images and Annotations.
Right-Click Menu
Most tools on the Chart Toolbar can also be accessed from the right-click menu (right-click in the chart area), as shown in the image below. Note that a different right-click menu exists in Professional 7.0.0; click the chart area to turn it on and change ContextMenus > ShowContextMenu from False to True in the Advanced tab.
