This exercise demonstrates how to combine data from two different reports into one XY Chart. Specifically, data from the Analytical Results II Report will be combined with data from the Water Levels II Report (allowing water levels on analytical results to be viewed).
This example uses the sample Springfield dataset, which is provided as a package of EDDs in the EarthSoft Community Center Downloads Dashboard for approved users under All ltems > Examples > EDDs.
1.Log in to a database. Click Reports in the Open group of the EQuIS Professional ribbon's Home tab.
2.Select the Water Levels II Report. Click Open and choose the following reporting parameters:
Parameters |
Selection |
|---|---|
Location Individual(s) |
B-30 |
Sample Date Range Start |
01/1/2007 |
Sample Date Range End |
01/1/2008 |
3.Click Go ![]() .
.
4.In Open > Reports, select the Analytical Results II Report and click Open.
5.Select the following reporting parameters:
Parameters |
Selection |
|---|---|
Location Individual(s) |
B-30 |
Sample Date Range Start |
01/1/2007 |
Sample Date Range End |
01/1/2008 |
Matrix(es) |
WG |
Result Analyte Individual(s) |
71-43-2 BENZENE |
Result Unit |
ug/l |
6.Click Go ![]() .
.
7.Click XY Charts in the Toolbar in the Analytical Results II tab to create a chart for this data.
8.In the Data pane, make the following selections:
Parameters |
Selection |
|---|---|
Dataset |
Analytical Results II |
X-Axis |
SAMPLE_DATE |
Y-Axis |
REPORT_RESULT_VALUE |
Group Series By |
CHEMICAL_NAME |
10.Click the Add Series icon in the Data pane to display the XY Chart.
11.From the Data pane, select the following:
Parameters |
Selection |
|---|---|
Dataset |
Water Levels II |
X-Axis |
MEASUREMENT_DATE |
Y-Axis |
EXACT_ELEV |
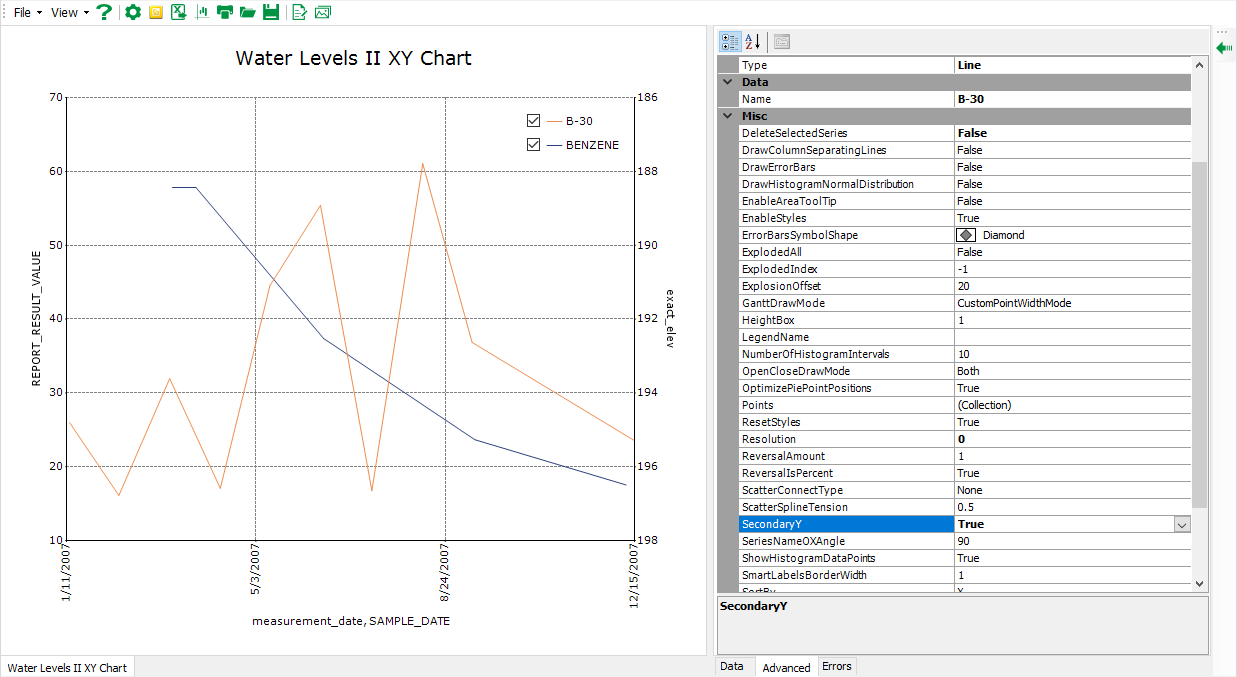
12.Click Add Series in the Data pane to display the Analytical Results in the XY Chart (see figure below).
Note: The left Y-axis is reversed because EQuIS Professional monitors Y-axis values that end with 'elev' or 'depth' and automatically set them as reversed. |
The figure indicates that the Water Levels and the Analytical Results series do not display well together in the graph. Trends from the Analytical Results Report are not immediately discernible. To make the chart easier to use, associate the Water Levels series with the right-axis or secondary Y-axis.
Associate Series with a Particular Axis or Associate Water Level with Right-Axis
1.Click B-30 in the legend to deselect.
2.Click View > Advanced > All {B-30}, which re-selects the deselected series of all the charts, and opens the Advanced tab for users to edit.
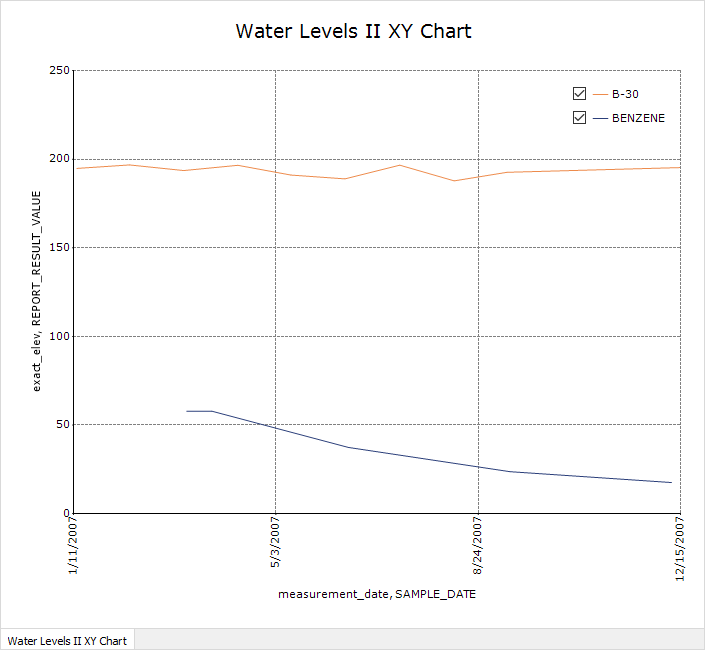
3.Modify (scroll down to) Misc > SecondaryY from False to True in the Advanced tab, which associates the B-30 Water Level series with the right-axis so it can be viewed along with the Analytical Result trend lines (see figure below).
Notes: •The Active Chart, All Charts, and All Series options may also be selected for editing chart attributes. If in All Chart editing mode, apply changes directly in the Advanced list (by expanding chart items to navigate to desired attribute for edits). •SecondaryY is used only when there is a primary or left Y-axis and a desire for a secondary Y-axis to display another series. See Example 3 in the help article Edit Axes if only the right Y-axis is desired. |