To change the properties of the Map widget, open the Widget Editor by selecting the More Options ![]() icon in the upper right corner of the widget to display the drop-down menu and then select the Edit menu option. The Map widget properties are divided into six tabs in the Widget Editor. Changes made on any tab will not be preserved until the user clicks Save on the Widget Editor header.
icon in the upper right corner of the widget to display the drop-down menu and then select the Edit menu option. The Map widget properties are divided into six tabs in the Widget Editor. Changes made on any tab will not be preserved until the user clicks Save on the Widget Editor header.
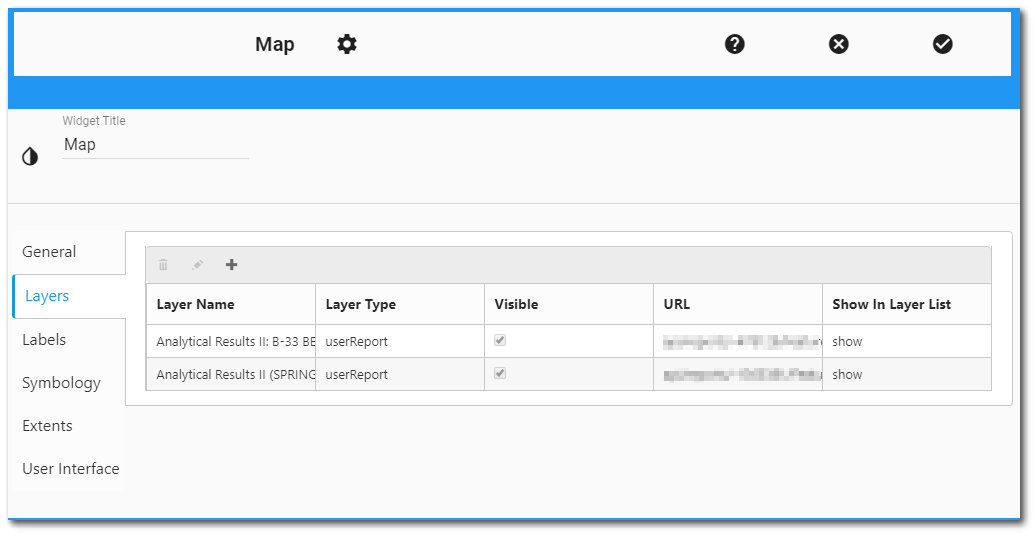
The Layers tab displays all layers added to the Map widget in a grid view. For each layer, the grid view provides the layer name, layer type, and URL and denotes whether the layer is visible by default and set to show in the Layer List. Use the Layers tab to add layers, edit layers, delete layers, and sort the view order of map layers.
Add New Map Layer
The following steps describe the general process to add a new map layer. Selection of the map layer type will dictate options available in the layer dialog.
1.Click the Add Layer ![]() icon on the top of the view grid frame to open a new dialog window with a Layer tab and an Edit Renderer tab.
icon on the top of the view grid frame to open a new dialog window with a Layer tab and an Edit Renderer tab.
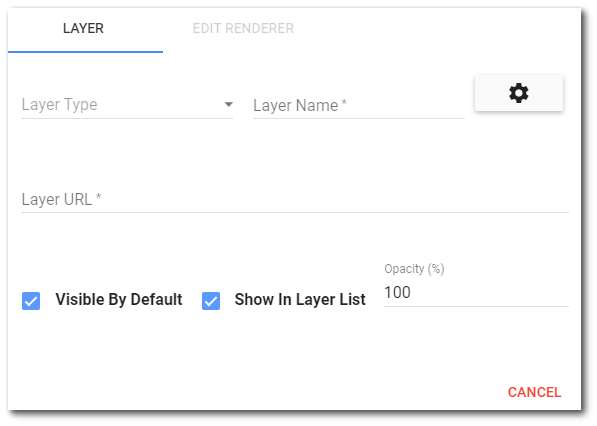
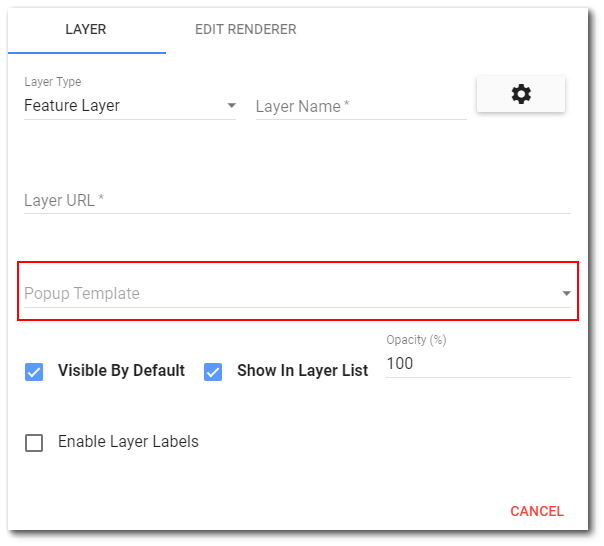
2.On the Layer tab, select the desired Layer Type from the drop-down menu. Options on the Layer tab of the dialog window change depending on the selected layer type. Each layer type is described below.
Notes: •When adding a URL for Map widget layer types, ensure that the URL content is allowed on the site. To allow resources from that URL, add the URL to the Content-Security-Policy section of the web.config file for the site. •If adding a secure layer that requires third-party authentication, a login pop-up will appear. To log in to a layer without a pop-up being displayed, an entry can be configured in ST_CONFIG. See ArcGIS Secure Map Layer for more information. |
Facility Layer |
The Facility Layer type allows users to set options (e.g., symbology, labels, order) for this layer, similar to other Map Widget layers. To use a Facility Layer, select a facility from the Facility Chooser. Multiple facility layers can be configured on a single Map Widget. |
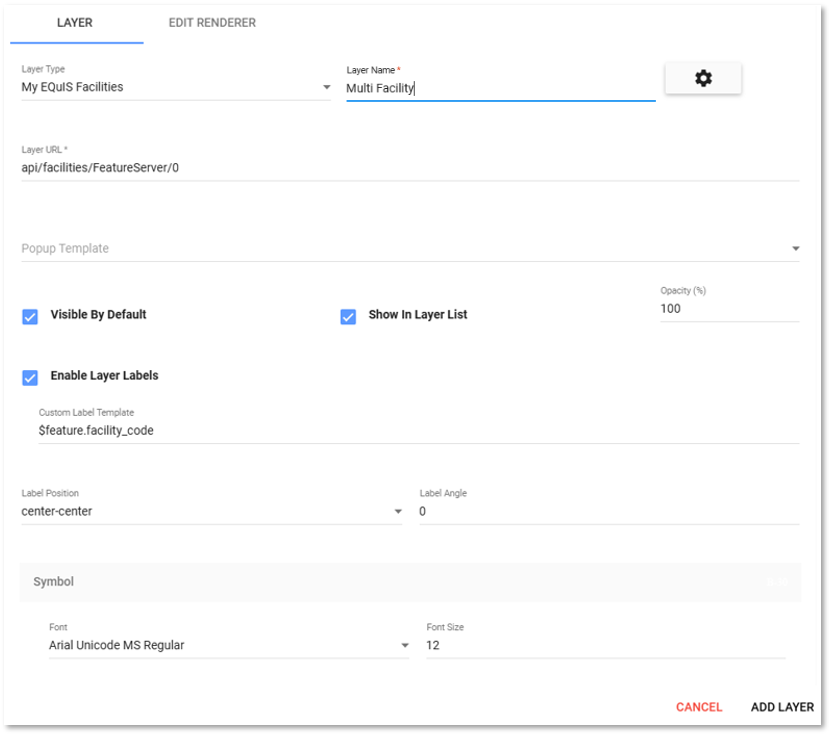
My EQuIS Facilities |
This layer is used to display all facilities. The Layer URL will automatically be populated with "api/facilities/FeatureServer/0". A simple renderer can be set up to display the facilities. |
User Report |
Plot a User Report as a layer on the Map. To use a User Report Layer, select a report (Report Chooser), configure the report options, and then configure the classification scheme. |
Feature Layer |
Plot an Esri Feature Layer, published alone, or as part of a Feature Service. To use a Feature Layer, provide the URL to the Feature Layer, and a layer name to display in the Layer List. |
ArcGIS Dynamic Layer |
Allows the user to work with a dynamic map service resource exposed by the ArcGIS Server REST API. A dynamic map service generates images on the fly. To use a dynamic map service, provide the URL to the layer and a layer name to display in the Layer List. |
ArcGIS Tile Layer |
Allows the user to work with a cached map service resource exposed by the ArcGIS Server REST API. A cached service accesses tiles from a cache instead of dynamically rendering images. To use a tiled map service, provide the URL to the layer and a layer name to display in the Layer List. Tiled services can have custom levels of detail. |
GeoRSS Layer |
GeoRSS is a live web feed that includes geographic features and locations. For example, a transportation department might maintain a GeoRSS of current vehicle accidents in their local area. ArcGIS Server Dynamic Map Service Layer can only come from ArcGIS Server (either Esri, or hosted by someone else). To use a GeoRSS Layer, provide the URL to the layer and a layer name to display in the Layer List. |
KML Layer |
Allows the user to work with an image map service resource exposed by the ArcGIS Server REST API. It is an Esri KML layer, defined by URL. The URL MUST be accessible by Esri (not Intranet or firewalled location). To use a KML Layer, provide the URL to the layer and a layer name to display in the Layer List. |
Image Layer |
Allows the user to work with an image map service resource exposed by the ArcGIS Server REST API. It is an Esri Image Service layer. To use an Image Layer, provide the URL to the layer and a layer name to display in the Layer List. |
Vector Tile Layer |
Plot an Esri Vector Tile layer. The URL can either be the layer URL or style JSON URL. Optionally, display levels can be set as a comma-separated list (11,12,13,14) and minimum scale and maximum scale can be defined. |
CSV Layer |
Plot a point layer based on a comma-separated values (CSV) file (.csv, .txt). A CSV file is a plain-text format used to represent tabular data and must include geographic point features (e.g., latitude, longitude). |
WMS Layer |
The WMS Layer allows users to work with georeferenced image layers, based on the OGC Web Map Services standard and accessed via an HTTP request. The initial request is a WMS GetCapabilities request, which might require CORS (Cross Origin Resource Sharing) or a proxy page to ensure the layer is accessible.
To use a WMS Layer, provide the URL to the layer, a layer name to display in the Layer List, and a sublayer that defines the georeferenced images displayed in the map. |
GeoJSON Layer |
The GeoJSON Layer allows users to display spatial data based on the GeoJSON format. Points, multipoints, polylines, and polygon geometry types are supported, but only one geometry type can be used per layer. Coordinates are required to use the WGS84 spatial reference and CORS (Cross Origin Resource Sharing), or a proxy page could be required to ensure that the layer is accessible.
To use a GeoJSON layer, provide the URL to the layer and a layer name to display in the Layer List. Users have the option to populate the layer URL by choosing the "Select from DT_FILE" button, which opens a dialog to select a GeoJSON file from the DT_FILE table. Additional parameters, such as a custom popup template and custom renderer, can be set for GeoJSON layers. Layer type is supported by Esri (https://developers.arcgis.com/javascript/latest/sample-code/layers-geojson/). |
3.Enter a Layer Name. The layer name will automatically populate when a facility or user report is chosen.
4.Enter the Web API URL for the layer in the Layer URL field. This will automatically be populated when a Facility Layer, My EQuIS Facilites, or User Report layer is selected as the map layer.
5.Set the layer default visibility by checking or unchecking the Visible by Default option.
6.Select the Show in Layer List option to have the layer available in the Layer List menu.
7.Set the Layer Opacity. This field allows the user to set the opacity of the layer. An opacity of '0' makes the layer fully transparent, while an opacity of '100' makes the layer fully opaque.
8.Depending on the selected layer type, other options might be available on the Layer tab of the dialog window. Set these options as appropriate.
a.See the Layer Labels section in this article for more detailed instructions on applying labels to a map layer type that supports labeling.
b.See the Popup Template section in this article for more detailed instructions on associating a popup window with a map layer.
c.For a Facility, My EQuIS Facilites, Feature, User Report or CSV layer, select the Edit Renderer tab in the dialog window. Within the Edit Renderer tab, the Enable Feature Reduction check box is an option to display point locations that fall within a specified radius as clusters. See the Enable Feature Reduction section in this article for more detailed instructions on configuring the feature reduction parameters. Custom renderers determine how the data will appear (i.e., render) on the map layer. See the Custom Renderers section in this article for more detailed instructions on how to setup the renderer for a map layer.
9.Once all required fields have been entered/selected, the Add Layer button will be displayed. Click the Add Layer button to add the layer to the Map widget. The new layer will appear in the grid view of the Layers tab of the Map Widget Editor.
Note: Selecting the JSON Editor |
|---|
Edit or Delete Existing Map Layer
To edit an existing map layer, select a layer (which will highlight it in blue) and click the Edit Layer ![]() icon on the top of the view grid frame to open a new dialog window with a Layer tab and an Edit Renderer tab. Change settings as desired. See the Add New Map Layer, Popup Template and Custom Renderers sections for more details about layer options. Click the Save button to retain changes. Click the Cancel button to close dialog window without saving changes.
icon on the top of the view grid frame to open a new dialog window with a Layer tab and an Edit Renderer tab. Change settings as desired. See the Add New Map Layer, Popup Template and Custom Renderers sections for more details about layer options. Click the Save button to retain changes. Click the Cancel button to close dialog window without saving changes.
To delete an existing map layer, select a layer (which will highlight it in blue) and click the Delete Layer ![]() icon on the top of the view grid frame. A message dialog will request confirmation before deleting the map layer.
icon on the top of the view grid frame. A message dialog will request confirmation before deleting the map layer.
Layer Labels
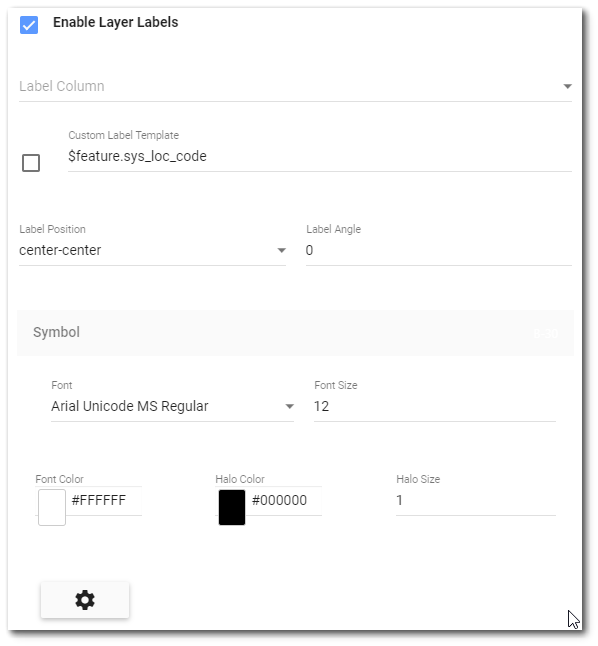
Layer labeling is supported for the following layer types: Facility Layer, User Report, My EQuIS Facilities, Feature Layer, CSV Layer, and GeoJSON Layer. When Enable Layer Labels is checked, users will be able to set label properties.
Note: The available options and default values can be different for different layer types. •The User Report layer displays a "Label Column" drop-down option and a check box to the left of "Custom Label Template", which aren't displayed for all layer types. •The default value for the "Custom Label Template" varies for different layer types: oFor User Report and Facility Layer types, the default value is $feature.sys_loc_code. oFor My EQuIS Facilities layer, the default value is $feature.facility_code. oFor the Feature Layer, CSV Layer, and GeoJSON Layer types, the placeholder value is $feature.code, with the expectation that the user will change the value because it is dependent on the data source. |
|---|
|
|
Warning: Unchecking the Enable Layer Labels check box with configured labels will result in the configuration being deleted and rechecking the box will apply default values for a default label. |
Label Column – When using a report, the label column will appear. This is a list of report fields in the report output. Select the Column to be displayed for the labels. Selecting a field will overwrite the custom label template with the field chosen.
Label Template – Sets the label template for the label. The template can make use of the report columns. The label template must be written in Esri Arcade script and is structured as $feature.XXX, where XXX is the report field name (e.g., $feature.sys_loc_code). If the label template is not properly formatted (e.g., does not begin with "$feature."), the symbols will not render on the widget.
Note: If the label values are numeric (e.g., REPORT_RESULT_VALUE), they will not be adjusted for culture |
|---|
Label Position – Controls the placement of the labels relative to the symbol. Select placement options using the drop-down menu. Options include left, center, and right that are above, below, or on the symbol.
Label Angle – Controls the rotation of the labels within the range -360 to 360 degrees. The center point for the rotation is the lower-left corner of the label. For example, a value of -30 would rotate the labels 30-degrees counter-clockwise.
Font – Select the drop-down menu to display available font types. Scroll to and select the desired font type. Font types include options for bold and italics.
Font Size – Set the font size for the labels.
Font Color – Set the font color for the labels. Click on the color selector to choose a color.
Halo Color – If a halo is desired, set the halo color for the labels. Click on the color selector to choose a color.
Halo Size – If a halo is desired, set the size for the labels.
Popup Template
Popup Templates are available for Facility Layers, Feature Layers, CSV Layers and User Reports by selecting a template from the drop-down menu. The available templates include Attribute Listing, Location Information, Time Series Chart, Crosstab, Feature Description, Chart, and Custom.
|
|
|---|
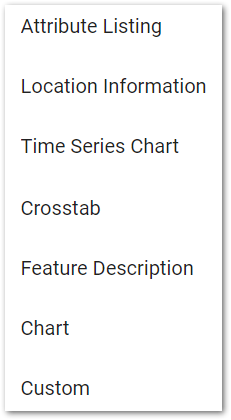
Attribute Listing – Displays all output values of the report.
Location Information – Displays the same information as Attribute Listing and Feature Description, but adds a list of all files (e.g., docs, photos) before the Attribute Listing.
Time Series Chart – Time series charts can be added to display when a location is selected. Refer to Time Series Chart for more information.
Crosstab – Displays a crosstab with column header = SAMPLE_DATE and row header = SAMPLE_NAME for every location.
Feature Description – Select to display the Attribute Listing.
Chart – Displays a chart using Esri Charts. Chart popups need to be configured with at least one MediaInfo template populated. Unlike the Time Series Chart popup, this will not requery the report data. Thus, this option works best with crosstab reports where all the data for the chart are present in a single row.
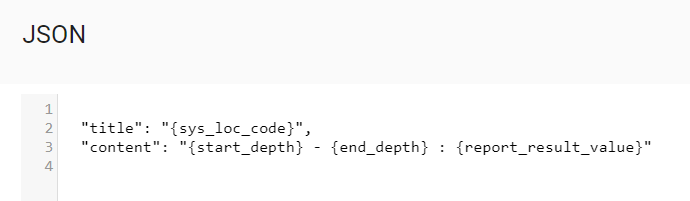
Custom – A Custom Popup Template is displayed where the title and content can be set in the JavaScript Object Notation (JSON) Editor. Selecting the JSON Editor ![]() icon will also open the JSON editing window. Widget properties can be manually edited in the window, as seen in the example below.
icon will also open the JSON editing window. Widget properties can be manually edited in the window, as seen in the example below.
The labeling of an Attribute field in the map legend can be edited in the JSON. In the Map widget, add the desired report layer and select the Edit Renderer tab. Select any renderer type other than "Simple" and select sys_loc_code in the attribute field. Then configure the default symbol and Save.
Custom Renderers
Custom renderers are available for Facility, My EQuIS Facilites, Feature, CSV, or User Report layers and determine how the data will appear on the map layer. A renderer must be defined for a User Report layer to work. When adding or editing a layer with a custom renderer, select the Edit Renderer tab on the dialog window. The Renderer Type options include simple, unique value, and class breaks. Select the drop-down menu to choose the Renderer Type.
|
|
|---|
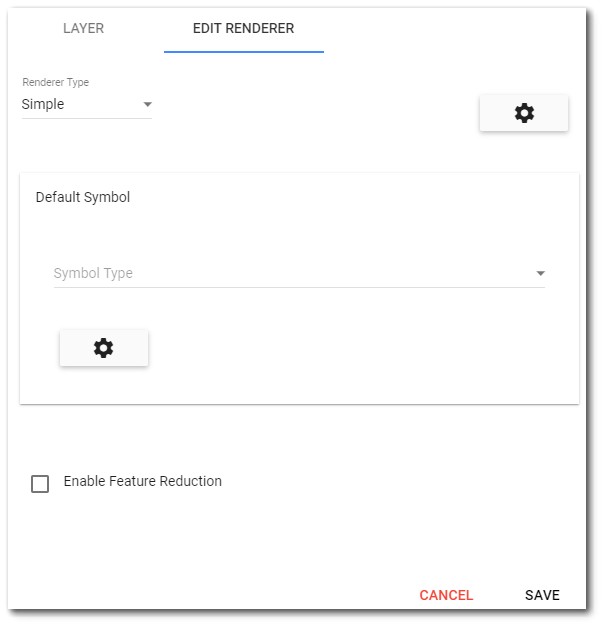
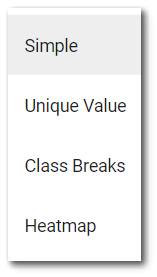
Simple – Displays the defined symbology for the map layer. The Renderer Type is set to "Simple" by default.
Unique Value – Allows user to select an attribute field to display on the map with the defined symbology.
Class Breaks – Allows user to select an attribute field and define a classification scheme for how the plot values will be grouped for display on the map with the defined symbology.
Heatmap – Displays data as a raster surface, emphasizing areas with a higher density of points along a continuous color ramp (see this article for more information on the heatmap renderer). As the name implies, higher values for the selected field appear 'hotter'.
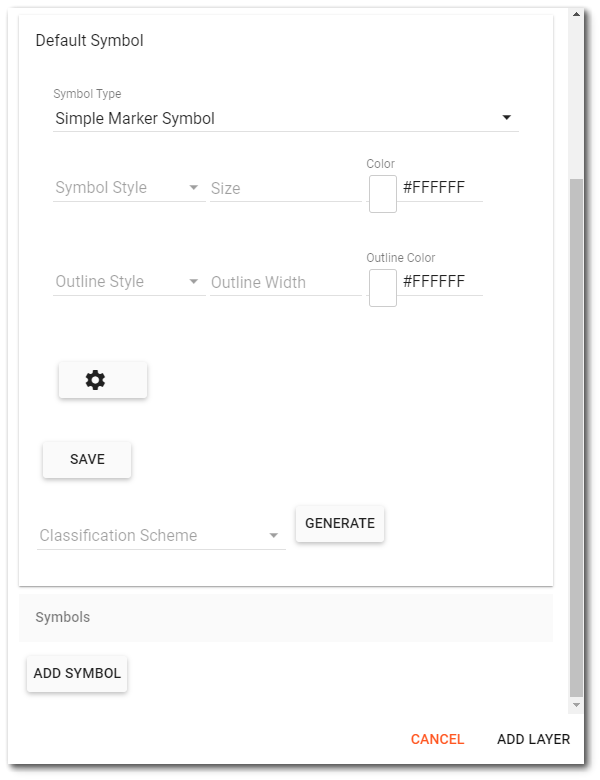
For each of the custom renderers, symbology must be set. This includes symbol type, style, size, and color.
Class Breaks Renderer
When the Class Breaks renderer is used, additional options must be selected.
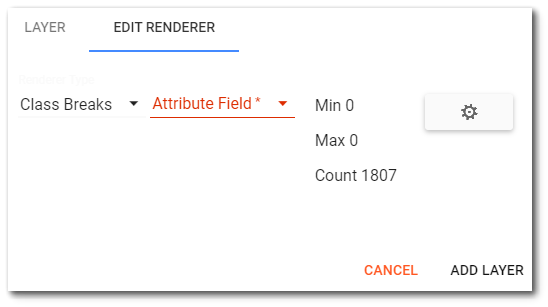
Attribute Field – This drop-down field allows the user to filter the displayed results.
Min – Displays the minimum value of the selected field attribute.
Max – Displays the maximum value of the selected field attribute.
Count – Displays the number of values of the selected field attribute.
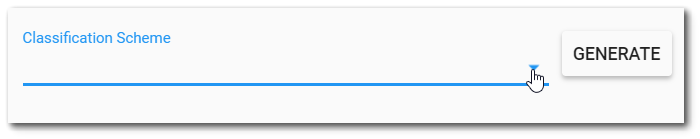
Classification Scheme – The classification scheme defines how the plot values will be grouped for display on the map. Members of each group will be displayed with the same symbol, and usually defined in the legend. Classification scheme options include:
•Equal Interval – Plots values in automatically calculated equal intervals. The number of intervals is specified in Number of breaks field.
•Defined Interval – Plots values in the intervals defined. Set the required interval in the Interval field (e.g., 100).
•Quantile – Classifies data into a certain number of categories with an equal number of units in each category. The number of categories is specified in Number of breaks field.
•Manual – Type pipe-separated values in the Values field to define the manual breaks.
Select the drop-down menu to choose the Classification Scheme. Set the necessary options and click the Generate button to create the class breaks. Each group can subsequently be edited.
Heatmap Renderer
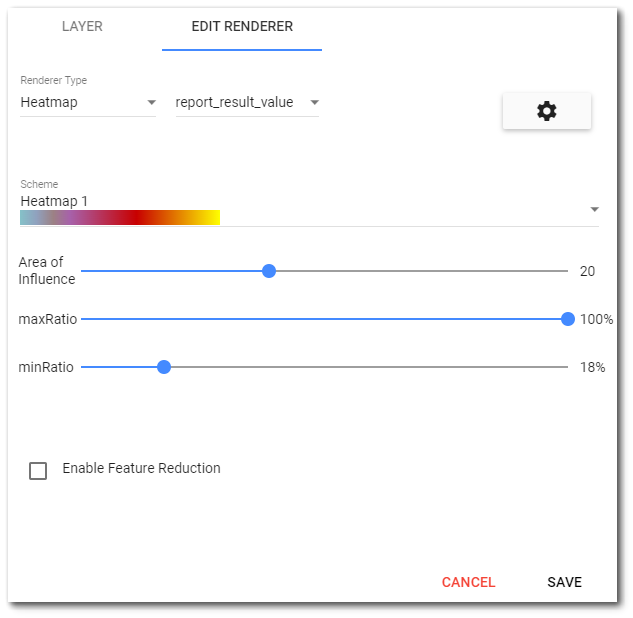
Attribute Field – This drop-down option allows the user to select which field will be used to generate the heatmap layer. In the image above, the attribute field is set to REPORT_RESULT_VALUE.
Scheme – Drop-down menu to select color scheme to apply to heatmap layer.
Area of Influence – The area of influence each point will have on generating the color ramp of the heatmap layer.
maxRatio – The maximum color stop ratio to use. As the maxRatio is decreased, the hot parts of the map get bigger. As the maxRatio is increased, the hot parts of the map get smaller.
minRatio – The minimum color stop ratio to use. As the minRatio is increased, the cold parts of the map get smaller. As the minRatio is deceased, the minRatio the cold parts get bigger.
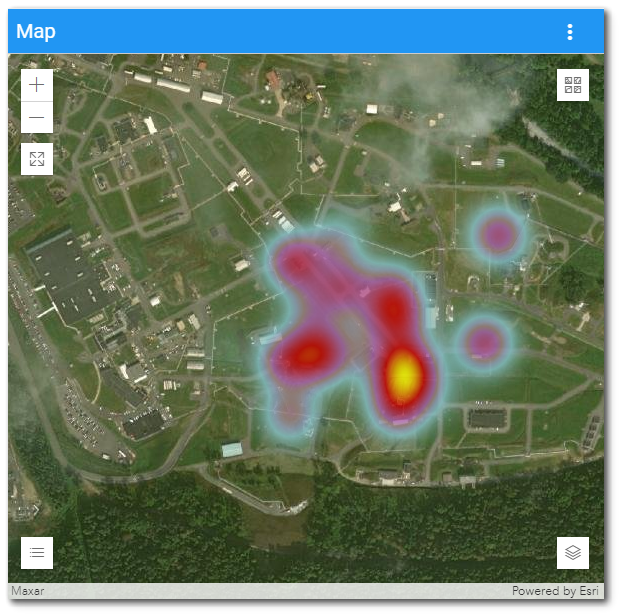
An example heatmap layer is displayed in the Map widget image below. A legend for the layer is automatically generated.
Set View Order of Map Layers
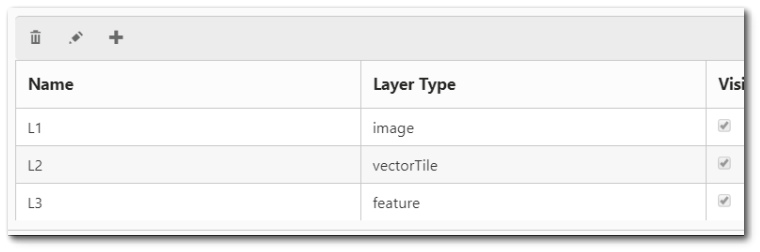
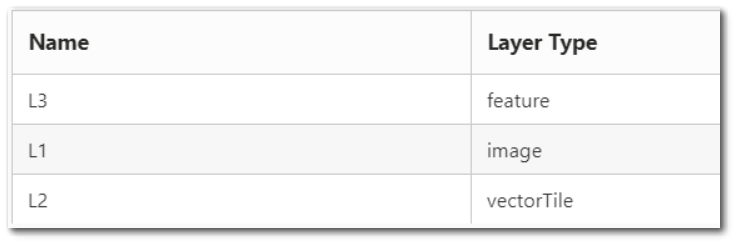
If two or more layers are added to the Map widget, a user can adjust the order that the layers are displayed on the map interface. When the map loads, layers are drawn in the order that the layers are displayed in the view grid within the Widget Editor. In the example below, layer L1 will be drawn first, then layer L2, and then layer L3. Therefore, L3 will be the top-most layer visible on the map.
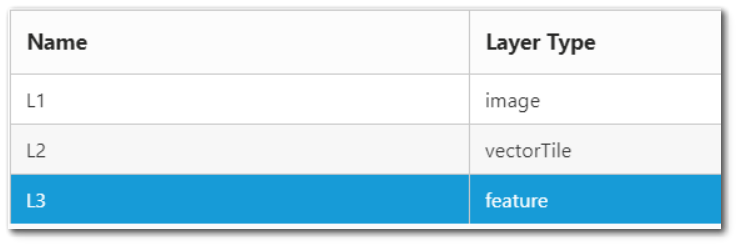
To change the display order: (1) select a layer (which will highlight it in blue), (2) click and hold down the selected layer, and (3) drag it to the desired position in the list of layers (view grid). After dragging the layer to the new position, the blue highlighting will be removed. To preserve the revised order of the layers, click Save on the Widget Editor header. The map will reload and draw the layers in the revised order.
In the example, layer L3 is selected and dragged to the first position in the view grid. When the map reloads, layer L3 will be drawn first, then layer L1, and then layer L2. Now L2 will be the top-most layer visible on the map.
|
|
|---|
Note: A layer cannot be moved to the bottom position in the view grid (i.e., the top-most display layer on the map). To make a layer the top-most layer on the map, move the layer(s) beneath it to a higher position in the view grid.
Using the current example, perform the following steps to move layer L3 back to the bottom position in the view grid. Select layer L3 and drag layer L3 below layer L1. Select layer L2 and drag layer L2 above layer L3. Now the layers are returned back to the original order. Save the changes and the map will redraw layer L1 first, then layer L2, and then L3 as the top-most layer. |
|---|