Any EQuIS Professional grid report output can create a crosstab report. For troubleshooting, see Troubleshooting Published Crosstabs.
Notes: •Crosstab reports can potentially be created from any data in EQuIS Professional grid output such as tables, views, or even output from another Crosstab. However, non-grid report data are not fully supported, and not all features may be available or work correctly. •In some cases, using a single "custom" filter on a column can lead to an incomplete export. Specifically, if a custom filter includes a condition based on another field in the table, then the filtered results may not be exported in their entirety. There may be additional conditions that lead to this behavior as well. At this time, we advise against using custom filters prior to clicking the Crosstab button. The EQuIS 7.22.2 Build resolved this behavior for exporting a crosstab with 'Group By' on a row header and filtered by row headers. |
Watch the following Crosstab Reports Office Hours videos for more information:
•Crosstab Reports in EQuIS – Basic
•Crosstab Reports in EQuIS – Intermediate
Create a Crosstab Report
The example shown here uses the Analytical Results II Report on the Springfield dataset using the following parameter selections.
Parameter |
Selection |
|---|---|
Location Group |
MonitWells |
Sample Matrix |
WG |
Result Analyte Group |
_PERC |
Result Unit |
ug/L |
To create a Crosstab report from the grid output in EQuIS Professional, click the Crosstab button:
This opens the Crosstab Configuration Form:
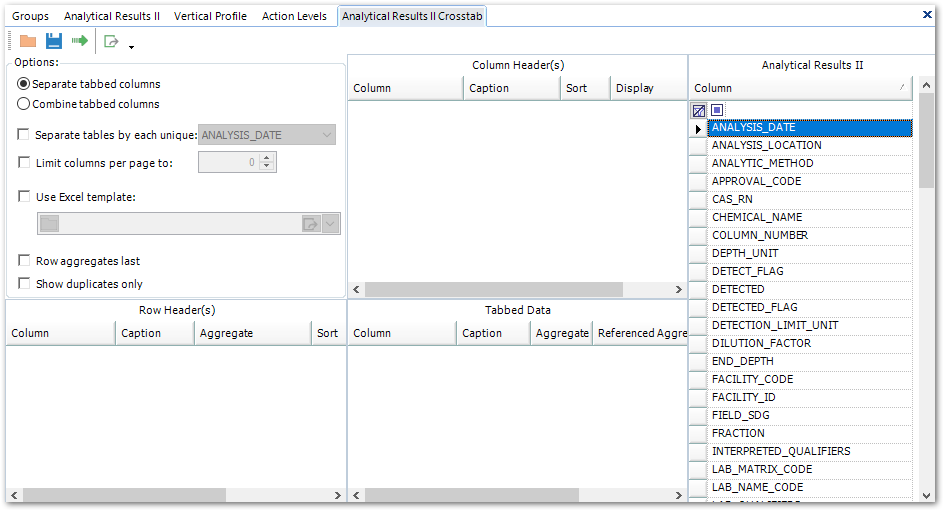
Configuring the Crosstab
The Crosstab Form has the following sections:
Available Columns
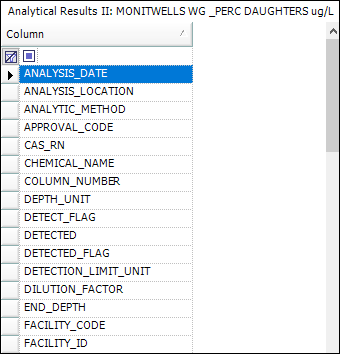
All of the fields for the report appear in the Available Columns list below the Report Name as shown above. The name of the report from which the Crosstab report is being created (either the System report name, the System report name with the appended parameters, or the saved user report name) displays above the fields in Available Columns pane. Use the search bar at the top of the list to quickly find fields from the report.
Note: To make a REMARK field available in a crosstab, add multiple REMARK fields to the base report. A REMARK field from standard report output could override a single REMARK column from Additional Fields. When multiple REMARK fields from different tables are included as Additional Fields, they automatically appear with unique names (formatted as TABLE_NAME_REMARK) in the crosstab selection list. |
Drag and drop the desired fields in the appropriate location (Column Header(s), Row Header(s) or Tabbed Data section). Select multiple fields with Shift and/or Ctrl keys while selecting fields.
This example uses the following report columns in the following sections.
Parameter |
Selection |
|---|---|
Column Headers |
CHEMICAL_NAME |
Row Header |
SYS_LOC_CODE SYS_SAMPLE_CODE |
Tabbed Data |
REPORT_RESULT_TEXT REPORT_RESULT_UNIT |
Remove any field that has been added to a section by selecting the field in that section and pressing the Delete key on the keyboard. A confirmation dialog will appear.
Column Header(s)
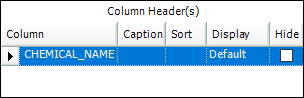
Each column header will appear as a row across the top of the resulting report for every unique combination of column header values in the report.
The help article Column Headers and Row Headers offers information related to the options in this section.
Row Header(s)
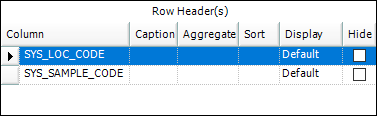
Each row header will appear as a column down the left side of the resulting report for every unique combination of row header values in the report.
The help article Column Headers and Row Headers offers information related to the options in this section.
Tabbed Data
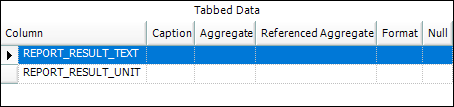
The fields selected in the Tabbed Data section make up the body of the report. Each selected field will appear as a column for each corresponding distinct column header value. Each row in these columns will be ordered according to the corresponding row header values.
For more information, see Tabbed Data.
Options
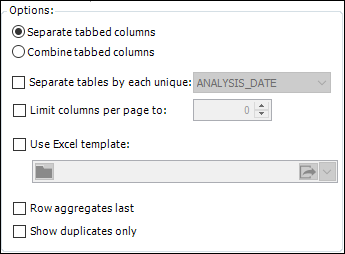
Customize the crosstab output here as described in Crosstab Options.
Running the Crosstab
Click Go ![]() to run the Crosstab.
to run the Crosstab.
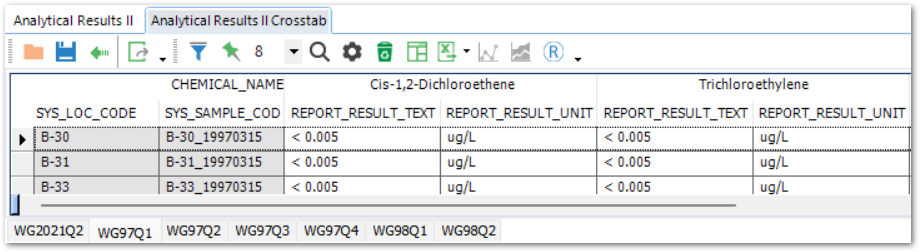
In this example, the following Crosstab report is the result. It outputs to multiple tables, separated by TASK_CODE. Each tab has the CHEMICAL_NAME column header at the top, the SYS_LOC_CODE and SYS_SAMPLE_CODE row headers to the left of the main report columns, and the REPORT_RESULT_TEXT and REPORT_RESULT_UNIT tabbed data columns per each column header value.
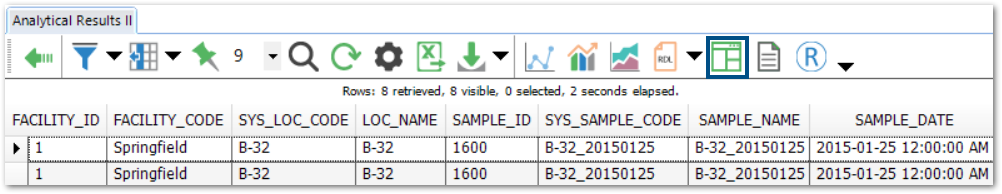
Note: When the crosstab is run, users may find what appear to be duplicate values in the tabbed data section of the crosstab. These cells will be highlighted in the Crosstab report as shown below.
 Duplicate Values
This can occur when a value that would make a result unique (e.g., SYS_SAMPLE_CODE, FRACTION, START_DEPTH, MATRIX, SAMPLE_DATE, etc.) is not included in either the Column Header or Row Header sections of the crosstab. Duplicates will not necessarily have the same value.
To resolve this, return to the Crosstab Configuration form, and add a Column Header or Row Header to make these values distinct.
A PDF export of a Crosstab grid report will not show all duplicates (as the row is autosized to a height of one line), although the highlighting to indicate duplicates are present still appears.
If users do not want any further row or column headers to distinguish the values in the tabbed data, use an aggregate to have a single value. |
Crosstab Auto-Resizing
Single Row Resizing – In a Crosstab grid output, any row can be resized by double-clicking in the row cell. For example, if a user sees a highlighted cell that contains duplicate values, double-clicking within that cell will resize the row to show all of the duplicate values.
Multiple Row and Column Resizing – If there are many duplicate values, users can resize all rows and columns simultaneously by holding down the CTRL key while double-clicking any row cell.
Notes: •Resizing all rows and columns may take several minutes depending on the size of the Crosstab. •Resized rows and columns will not persist if the Crosstab is closed and then reopened. •The Crosstab functionality to automatically resize columns and rows to fit data is disabled by default to avoid impacting performance for large Crosstabs. This functionality may be enabled in custom reports. Contact EarthSoft Support for more information. |
Warning: It is not necessary to resize rows or columns in EQuIS Professional before exporting to Excel. When the data are exported to Excel, the rows and columns will auto-fit to display all duplicate values. |
Other Crosstab Actions
The toolbar at the top of the Crosstab Configuration Form and the crosstab output provides the following functionality.
Configuration Form Toolbar: ![]()
Output Toolbar: ![]()
Button |
Name |
Config / Output |
Description |
||||||||||||||
|---|---|---|---|---|---|---|---|---|---|---|---|---|---|---|---|---|---|
|
Open |
Both |
Open a previously saved Crosstab configuration (*.xml file). |
||||||||||||||
|
Both |
Save the current crosstab configuration for later use. |
|||||||||||||||
|
Go |
Config |
Run the Crosstab (create Crosstab table(s) based on current configuration). |
||||||||||||||
|
Go Back |
Output |
Go back and view/edit the current Crosstab configuration. |
||||||||||||||
|
Both |
Publish the Crosstab report to the database. Clicking this will open the Crosstab Publisher Form. |
|||||||||||||||
|
Output |
Adds filters to table column headers |
|||||||||||||||
|
Removes filters from the columns |
||||||||||||||||
|
Pin |
Output |
Pin columns for easier horizontal scrolling within Crosstab Report. |
||||||||||||||
|
Find |
Output |
Find and Replace tool |
||||||||||||||
|
Properties |
Output |
Opens a Properties pane to the left of Crosstab output. The Properties pane displays advanced display options for the currently selected row, column or cell in the Crosstab output table. |
||||||||||||||
|
Release |
Output |
Release source data to reduce memory usage. |
||||||||||||||
|
Crosstab |
Output |
Create a crosstab from the current output. |
||||||||||||||
Various |
Export |
Output |
Export buttons only show one at a time. Click the down arrow next to the displayed export button to see the full list of export options.
|
||||||||||||||
|
XY Chart |
Output |
Click to create an XY chart with crosstab results. Refer to the help articles below for more information about XY charts. •XY Chart Basics: Create, Clear, Save & Load Charts and Parameters |
||||||||||||||
|
XYZ Chart |
Output |
Click to create an XYZ chart with crosstab results. Refer to the help article Create and Export XYZ Chart for more information about XYZ charts. |