XYZ Charts are three-variable charts: Contour plots, dot plots, and surface plots.
To launch the XYZ Chart interface, select the XYZ Chart ![]() button on the Grid Toolbar after generating report output.
button on the Grid Toolbar after generating report output.
In addition to the documentation in the XY Charts chapter, see XY Charts - 'Name of worksheet must be unique in a workbook.' Error for troubleshooting. Watch the Office Hour video on Chart Features in EQuIS Professional for more information.
Example – Create XYZ Chart
The example inputs below are based on the Springfield demonstration database.
1.Select Reports ![]() on the Home ribbon in EQuIS Professional.
on the Home ribbon in EQuIS Professional.
2.Select the Analytical Results II Report and click Open.
3.Select Matrix = WG. Leave all other values as default (no selection).
4.Run the report by clicking Go ![]() . Results will be returned in grid format.
. Results will be returned in grid format.
5.Use the Filter ![]() button to select the value shown below.
button to select the value shown below.
a.CHEMICAL_NAME = Benzene
6.To create an XYZ Chart, click XYZ Charts ![]() .
.
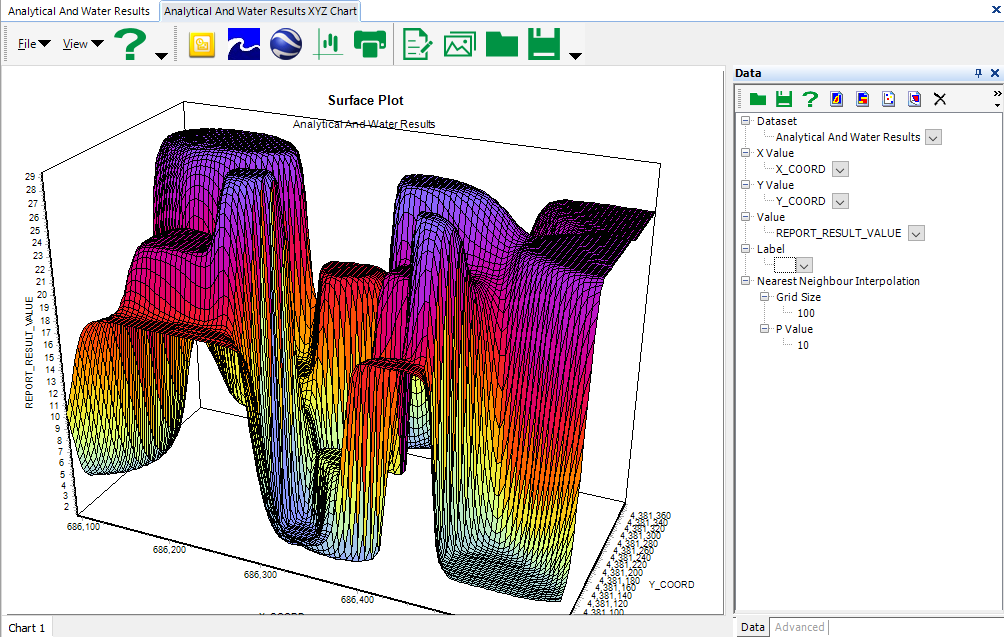
7.The XYZ Charts menu panel will be displayed on the right-hand side. Make the following selections:
a.Dataset: Analytical Results II
b.X-Axis: X_COORD
c.Y-Axis: Y_COORD
d.Value: RESULT_NUMERIC
e.Label: Default (No item selected)
f.Nearest Neighbor Interpolation: Defaults
8.Select Surface Plot to create the chart.
9.To change the aspect of the contour, do either of the following:
oClick and drag the chart.
oClick the Advanced tab and edit the values in the Aspect section.
Export XYZ Chart
Upon creation of an XYZ Chart, the chart/data are available for export to the following formats using the Export buttons on the toolbar (third-party software must be installed).
•Microsoft Outlook
•Google Earth
•My Charts as a .jpg file
•Surfer (by Golden Software)
oExporting to Surfer before creating the contour generates only the .dat file, so that users can choose their own gridding options (e.g., nearest neighbor, kriging etc.).
oExporting to Surfer after creating the contour generates the .dat, .grd (nearest neighbor interpolation), and the plotted contour. Users can review the contour, then go back to the .dat file and change the gridding options, if desired.
Note: For Surfer exports, have the following in place: •Surfer should be installed on the local machine. •The user should be using a Plus Graphics License or higher. |