•Add Column Headers and Row Headers
oAggregate (Row Header(s) property only)
oSort
oHide
Column Headers are additional rows of values related to the cross-tabbed fields visible across the top of the final Crosstab Report.
Row Headers are additional columns of values related to the cross-tabbed fields visible on the left of the final Crosstab report.
Add Column Headers and Row Headers
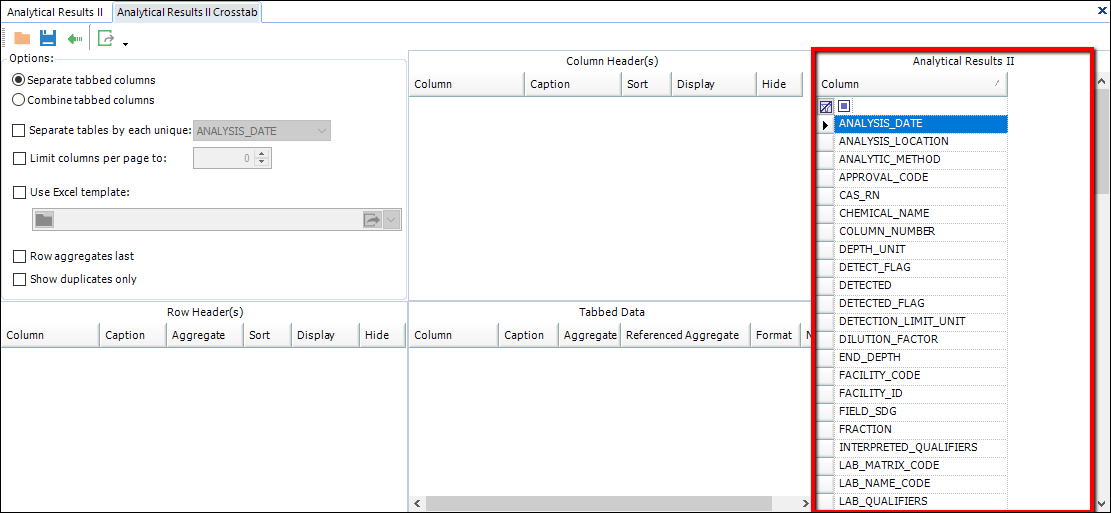
To select Column Headers or Row Headers, drag and drop the desired field(s) from the list of Available Columns list located on the right side of the Crosstab Configuration form onto the Column Headers or Row Headers grid section. The Available Columns vary based on the report from which the Crosstab is created. (The additional Available Columns for an Action Level Exceedance Report are explained here.)
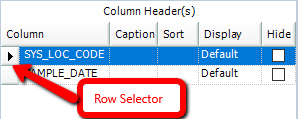
Tip: When having trouble selecting a row in a grid section, try clicking on the Row Selector.
|
For example, create a Crosstab Report that includes location and date information in the Column Headers across the top of the Crosstab. Specify column header(s) by dragging the corresponding field(s) from the list of Available Columns and dropping the field(s) onto the Column Header(s) grid. In this example, drag SYS_LOC_CODE and SAMPLE_DATE and drop them onto the Column Header(s) grid.
Note: Previous builds showed Available Columns as the label for this section. The label now shows the name of the report from which the Crosstab report is being created: either the System report name, the System report name with the appended parameters, or the saved user report name, if used. |
Reorder Fields
To reorder fields after they have been placed in the Column Headers or Row Headers grid, drag and drop the fields into the desired order.
Remove/Delete Fields
To remove or delete rows from the Column Header(s) section, select the row(s) to remove and then press the Delete key. Then click YES on the delete confirmation.
Selecting Multiple Fields
Users can select multiple rows in a grid section by using the CTRL or SHIFT keys for Drag/Drop, Reordering, and Deleting actions. Dragging and dropping multiple fields is only supported from the Available Columns list. It is not yet supported from either the Column Header(s) or Row Header(s) sections.
Warning: If more than 12 Column Headers are added, generating the Crosstab will show the following message: "EQuIS displays up to 12 column headers; however, additional column headers display when the crosstab output is exported (e.g., to Excel, etc.)."
Note that the crosstab output in Professional will show up to the first 12 column headers, but the tooltip will show a list of all the configured headers and all the non-hidden column headers will be exported when the crosstab result is exported to Excel etc. |
Set Header Properties
Column or Row Headers have the following properties:
•Aggregate (Row Header only; see also Tabbed Data or full details at Aggregate Feature)
•Sort
•Hide
Caption
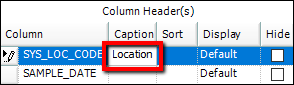
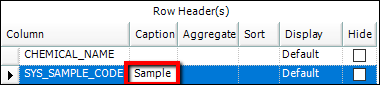
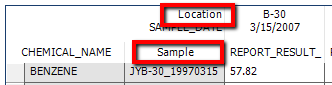
The Caption property defines the display text shown for this field's label. This is useful if users do not want to use the actual field name as the caption. For example, usesrs can enter "Location" into the Caption property to display that caption in the final report, instead of the SYS_LOC_CODE. If null, the default text that is displayed is the Column (Field) name.
|
|
|
Aggregate (Row Header(s) property only)
Users can set Row Header(s) to display an aggregate calculation for all aggregate values in the Tabbed Data section.
Note: The same field (from the Available Columns list) needs to be added to the Tabbed Data section and have the same aggregate selection set or an error will occur when trying to run the Crosstab. |
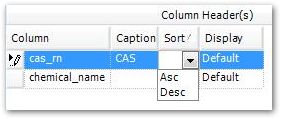
Sort
All Column and Row Headers will default to be sorted first in ascending order, according to the order in which they appear in their respective header section. This is needed for the base crosstabbing functionality. To set sorting priority on selected fields, the Sort Column allows the specification of how the headers should be sorted ("Asc" for Ascending, or "Desc" for Descending). Headers set with a specified sort will be sorted first, according to the specified sort order (ascending, descending), before other columns that have not been set to an explicit sorting. The resulting crosstab columns to the right of the Row Header(s) output columns will be sorted according to the Column Header(s) sorting properties. The resulting crosstab rows will be sorted according to the Row Header(s) sorting properties.
Tip: The rows of the crosstab can be subsequently sorted in the crosstab output form, after running the crosstab from the crosstab configuration, by clicking on the column caption cell to toggle the sorting order. |
Display
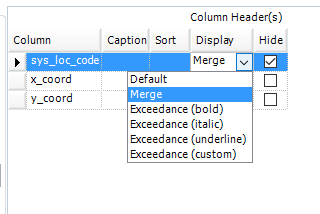
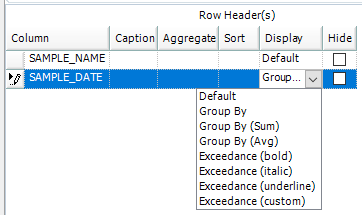
The Display column lets users specify how the column will be displayed in the final report with the following options:
•Default – Generic, non-specialized view of data.
•Merge (Column Header(s) only) – Columns headers containing the same value will be merged (horizontally) when exported to Excel. The merging of cells only occurs on export and will not apply to the grid in EQuIS Professional.
•Group By (Row Header(s) only) – The group by option will group all rows in the Crosstab by every distinct value of the specified row header. These groupings will be displayed in the Crosstab grid output in Professional and in the exported Crosstab documents. When one of the Group By options is selected, all rows with the same value for the selected report field and will be preceded by a separator row displaying the value the rows have been grouped by. Additionally, users can select "Group By (Sum)" and "Group By (Avg)". Selecting either of these will add a Sum or Average of the tabbed data values at the end of the grouped by section.
•Exceedance (bold) – Bolds exceedances.
•Exceedance (italic) – Italicizes exceedances.
•Exceedance (underline) – Underlines exceedances.
•Exceedance (custom) – Customize this option to display exceedances in a unique manner.
|
|
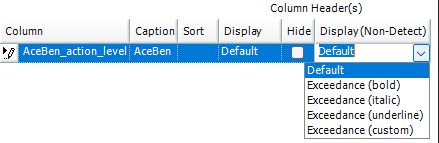
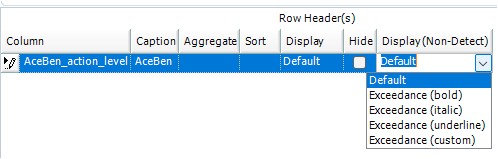
Display (Non-Detect)
The Display (Non-Detect) column is used to define the displaying formats for non-detect exceedances and has the following options:
•Default – Non-detect exceedances take the exceedances formats defined by Display.
•Exceedance (bold) – Bolds exceedances of non-detects.
•Exceedance (italic) – Italicizes exceedances of non-detects.
•Exceedance (underline) – Underlines exceedances of non-detects.
•Exceedance (custom) – Customize this option to display exceedances of non-detects in a unique manner.
Note: The displaying formats of the row headers of the Crosstab output are always defined by the Exceedance (xxx) of Display and not by that of Display (Non-Detect). |
Hide
The Hide check box lets users specify whether or not the column will actually be displayed in the final report. In some cases, it may be necessary to include a value for sorting or Detection formatting purposes but not have the value actually displayed in the report. In that case, check the Hide check box.