Use the Aggregate feature in a Create and Format Crosstab Reports with any of the standard EQuIS reports to include statistical computations such as average, maximum, and minimum in report output. Variations include the following:
•Tabbed Data Aggregates populate the aggregate values in the main cells of the report output grid.
•Row Header Aggregates add row header columns populate with the aggregate values for each row, for easy reference alongside the raw data of the main output grid.
•Referenced Aggregates return a referenced value from a related aggregated field.
The following aggregate options are available for both Tabbed Data and Row Header aggregates:
•Count, Count (Distinct), Count (Non-Null), Count (Null)
•First
•Last
•Minimum
•Median
•Standard Deviation
•Sum
The following aggregate options are only available for Tabbed Data aggregates:
XY Charts and XYZ Charts can also be created from these aggregated results.
For datasets that contain a mix of numeric and non-numeric values, arithmetic aggregations (i.e., all aggregates except First, Last, and the Count aggregates) will proceed with the appropriate calculation while ignoring any non-numeric values. These results will be flagged with an asterisk (*) in the final Crosstab report.
Note: To be conservative, exceedance formatting (for an action level's ..._FLAG or ..._WARNING_FLAG) will be applied to an aggregate record if any result within the aggregate set exceeded the criteria, even if the result displayed did not exceed the criteria. If this logic is not the desired outcome, use of aggregates with exceedance formatting is not recommended.
For example, if a result set 1.00 and 10.0 is aggregated as an average, and the action level is 8.00, the record will appear flagged due to the result of 10.0, although the displayed value of 5.00 is not an exceedance.
To check the result displayed from an aggregate set compared to the applied _FLAG, a user can add that related _FLAG column. |
Aggregate Average Option
The Aggregate Average option determines the appropriate number of significant figures using the equis.significant_figures function in the EQuIS database.
The Crosstab Aggregate Average option—because it take significant figures into consideration—differs from the Excel Average function that users may be familiar with. For example, if a series of values is included in the date to be aggregated, and the series includes a mix of three and four significant figures, the calculation will be performed and rounded to the greater number of significant figures present, in this case, four.
If significant figures and rounding should not be considered in the calculation, the Aggregate Average function should not be used. An alternate means to calculate the average would include both the Sum and Count Aggregates, allowing Excel to perform the Average function on the resulting data.
Aggregate Count Options
There are four count options for Crosstab Tabbed Data Aggregate.
Count Option |
Definition |
|---|---|
Count (All) |
Count the number of rows. |
Count (Distinct) |
Count the number of distinct values. |
Count (Non-null) |
Count the number of non-null values. |
Count (Null) |
Count the number of null values. |
Aggregate Maximum Option
To see an example of a report using the Aggregate Maximum Option:
1.Open an Analytical Results II report.
Tip: If report parameters were saved from Reporting Create and Format Crosstab Reports, open this report with the Open File button (if saved locally) or the User Report drop-down menu (if saved to database). |
2.Select input parameters. The example shown here uses the following Springfield example data.
Parameter |
Selection |
|---|---|
Location Group |
MonitWells |
Sample Date Range Start |
01/1/1997 |
Sample Matrix(es) |
WG |
Result Analyte Group(s) |
_PERC |
Result Unit |
ug/l |
3.Click Go ![]() to run the report.
to run the report.
4.Click Crosstab on the Analytical Results II Report toolbar.
5.In the Crosstab window, make the following selections. This will populate the tabbed data cells with the maximum result in the method analyte group for each sample, date, and locations (column headers) combination.
Section |
Column Selection |
Caption |
Aggregate |
|---|---|---|---|
Column Header(s) |
SAMPLE_DATE SYS_LOC_CODE SYS_SAMPLE_CODE |
Sample Date Location Code Sample Code |
NA |
Row Header(s) |
METHOD_ANALYTE_GROUP |
Method Analyte Group |
NA |
Tabbed Data |
REPORT_RESULT_VALUE |
Maximum |
Maximum |
Tip: To remove an Aggregate selection, highlight the selection and press the Esc key. If the selection was saved, click the row and press Delete to remove the values from the Tabbed Data column. Drag and drop new values from the Available Columns list back to the Tabbed Data column. |
6.Click Save and name the configuration MONIT_PERC_AGGREGATE_CROSSTAB.
7.Click Go ![]() to display the report.
to display the report.
Aggregate Maximum (Detects Only) Option
Reference Aggregate Maximum Option. Note that when a cell of the tabbed data contains multiple values and some are non-detected, the Maximum (Detects Only) calculates the maximum value after excluding the non-detected values.
Aggregate Minimum (Detects Only) Option
Reference Aggregate Maximum Option. Note that when a cell of the tabbed data contains multiple values and some are non-detected, the Minimum (Detects Only) calculates the minimum value after excluding the non-detected values.
Note that the Tabbed Data Section in the Crosstab window should be changed as follows. This will populate the tabbed data cells with the minimum result in the method analyte group for each sample, date, and locations (column headers) combination.
Section |
Column Selection |
Caption |
Aggregate |
|---|---|---|---|
Tabbed Data |
REPORT_RESULT_VALUE |
Minimum Aggregate Result |
Minimum |
Aggregate Sum Option
To see an example of a report using the Aggregate Sum Option:
1.Click the Crosstab button in the Analytical Results II Report toolbar.
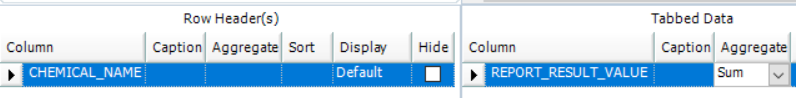
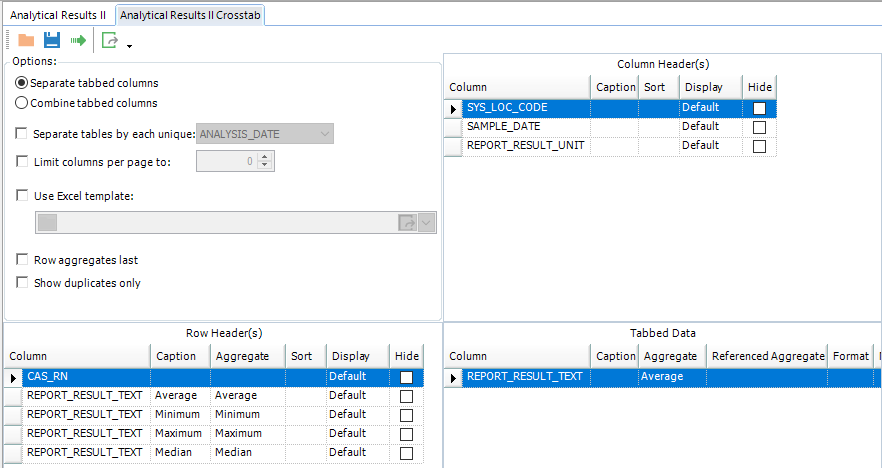
2.Set up the Row Header(s) and Tabbed Data fields (see image below), then any other preferred options (such as SYS_LOC_CODE and REPORT_RESULT_UNIT for Column Headers).
3.In the Tabbed Data section, click Sum in the Aggregate column for REPORT_RESULT_VALUE.
Notes: •To remove the Aggregate: Sum selection, select None. •It is possible to delete REPORT_RESULT_VALUE from the Tabbed Data column and re-enter without adding an Aggregate value. |
4.Click Go ![]() .
.
In the resulting report, note how the sum of these individual chemical results are returned.
Aggregate Sum (Detects Only) Option
Reference Aggregate Sum Option. Note that when a cell of the tabbed data contains multiple values and some are non-detected, the Sum (Detects Only) calculates the summation of the multiple values after excluding the non-detected values.
Referenced Aggregate Feature
The Referenced Aggregate feature allows the user to perform an aggregate based on another aggregate. More specifically, the Referenced Aggregate field is used to create a column in the crosstab based on an Aggregate (such as maximum results), which includes the referenced value from a related field (such as the chemical name or date or location of the maximum value in the aggregate column). Add the row with the Referenced Aggregate immediately following the row being referenced. Note that this feature does not work with the Average or Count aggregates, since they do not produce a data point to reference that exists in the dataset.
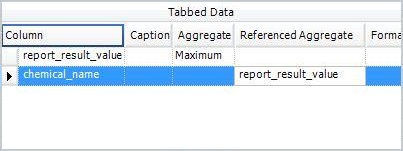
For example, selecting the CHEMICAL_NAME field in the Tabbed Data section while setting the Aggregate setting to "Maximum", and setting the Referenced Aggregate setting to "REPORT_RESULT_VALUE" will display the CHEMICAL_NAME value with the maximum REPORT_RESULT_VALUE value for that corresponding row/column.
Following from the example in the previous section, a referenced aggregate may be added as follows:
5.Click Back ![]() to return to the crosstab configuration.
to return to the crosstab configuration.
6.Add CHEMICAL_NAME to the Tabbed Data pane.
7.In the Referenced Aggregate field for CHEMICAL_NAME, enter REPORT_RESULT_VALUE.
8.Click Go ![]() and find the first column with a 'B-38' SAMPLE_ID.
and find the first column with a 'B-38' SAMPLE_ID.
The maximum value for this sample on this date is 19.01, and the chemical from the _PERC method analyte group that has this maximum value is Trichloroethyene. If more than one chemical has the same maximum REPORT_RESULT_VALUE for a particular location, sample, and date, all chemicals with this value will be shown as is seen with the B-30 SAMPLE_ID.
Multiple Aggregate Columns – Tabbed Data
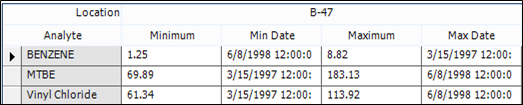
If desired, a crosstab may be constructed that displays multiple aggregates. For example, it could have one column that displays the Maximum value on each date, and a second column that displays the Minimum value on each date.
To see an example of a crosstab with multiple aggregate columns:
1.Add REPORT_RESULT_VALUE into the Tabbed Data pane from the Available Columns list, as many times as number of columns desired, in the crosstab configuration screen.
2.Set the desired Aggregate for each REPORT_RESULT_VALUE in the design, for example, Minimum for one, and Maximum for another.
3.Change the Caption of each REPORT_RESULT_VALUE field to reflect the aggregate displayed in that field.
4.Click Go ![]() to verify the aggregate settings in the Crosstab Report.
to verify the aggregate settings in the Crosstab Report.
Row Header Aggregates also support multiple aggregate columns.
Note: Multiple aggregate columns are not supported for *_LIMIT (e.g., REPORTING_DETECTION_LIMIT) fields. |
Referenced Aggregates may still be used with multiple Aggregated Tabbed Data fields. To add multiple referenced aggregate columns, follow the instructions below.
5.Click Back ![]() to return to the crosstab configuration.
to return to the crosstab configuration.
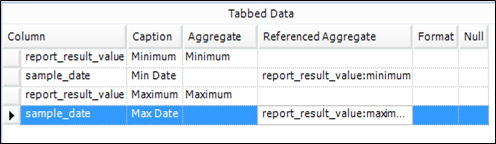
6.Add the desired referenced aggregate fields from the Available Columns list (such as CHEMICAL_NAME or SAMPLE_DATE) multiple times, one for each aggregate to be referenced.
7.In the Reference Aggregate field, enter REPORT_RESULT_VALUE: "Aggregate" where "Aggregate" is the aggregate selected in number two above. Two examples follow.
a.REPORT_RESULT_VALUE:Minimum
b.REPORT_RESULT_VALUE:Maximum
8. Change the Caption of each Referenced Aggregate field to reflect the aggregate displayed in that field.
9.Click Go ![]() to verify the aggregate settings in the crosstab report.
to verify the aggregate settings in the crosstab report.
Row Header Aggregates
Row Header Aggregates generate the average, maximum, minimum, etc. of a tabbed data row. The following conditions are required:
1.No cell of the tabbed data contains duplicated values. Otherwise, the following error message occurs:
When an Aggregate of a Row Header is configured, the aggregated-Row-Header-related Tabbed Data cannot include duplicates.
Please update the configuration of the Row Header and/or Column Header to avoid multiple values in a single cell of Tabbed Data output and try again. To identify the duplicates in the Tabbed, run the crosstab by removing the Aggregate(s) from Row Header(s). |
Tip: If the above error occurs, run the crosstab using the Average Aggregate option for the Tabbed Data to process the duplicates. |
2.The aggregate column must be selected only once in the Tabbed Data section, and the column must also be present in the Row Header(s) section. Otherwise, one of the two errors below may occur.
The Column name xxx in the aggregated Row Header(s) must also be included in the Tabbed Data section. Please update the crosstab configuration and try again. |
or
The Column name xxx in the aggregated Row Header(s) may only occur once in the Tabbed Data section. Please update the crosstab configuration and try again. |
Example Crosstab with Row Header(s) Aggregate configuration:
Example Row Header(s) Aggregate Output:
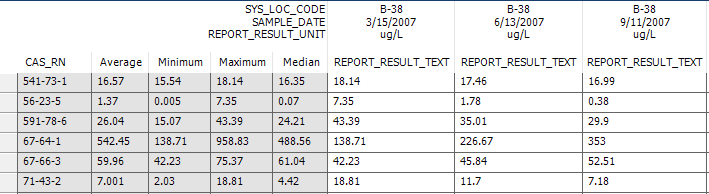
Notes: •Rounding Average: Its final value is rounded by taking the maximum of the significant figures of all the values of a tabbed data row. For example, an average of 3.46 is computed from 1.4, 4 and 5 (in a row of tabbed data). Because the maximum significant figure is 2, the final average of 3.5 is present. •Processing empty (or null or missing) value: An empty value is ignored in processing Average, Maximum or Minimum. For example, when a row of tabbed data has the 4 values of 1.4, empty, 4, 5, the average equals (1.4+4+5)/3 = 3.5. •Processing non-detects: Non-detect and detect value are not differed in calculating Average, Maximum or Minimum. |