A multiple facility dashboard is an optional dashboard configuration (see Create or Transfer a Dashboard) used to display widgets and data for multiple facilities on a single dashboard, or to navigate to multiple facilities from a single dashboard. A dashboard configured with multiple facilities can simplify dashboard management and allow users to quickly view data for the selected facilities.
Multiple facility dashboards can be designed to meet an Enterprise user’s specific needs, such as a tabbed dashboard with a specific tab for each facility, displaying multiple facilities on a single Map widget, or using a facility group to view data in a Time Series Chart widget. These use case scenario examples, with step-by-step instructions, are detailed below.
Tabbed Multiple Facility Dashboard
Configure a tabbed, multiple facility dashboard as follows:
1.Create a new dashboard or select the dashboard to be edited.
2.Open the Dashboard Editor.
3.Create a section for each facility.
4.In the JSON editing window, set the "layout" property to "tabs" (see “Create Tabbed Section Layout” in the Dashboard Editor article for detailed instructions about the tabbed dashboard layout). The tabbed layout will be visible once the dashboard edits are saved.
5.Edit each section title to be a desired facility name.
6.Within each section, add widgets and set them to the facility.
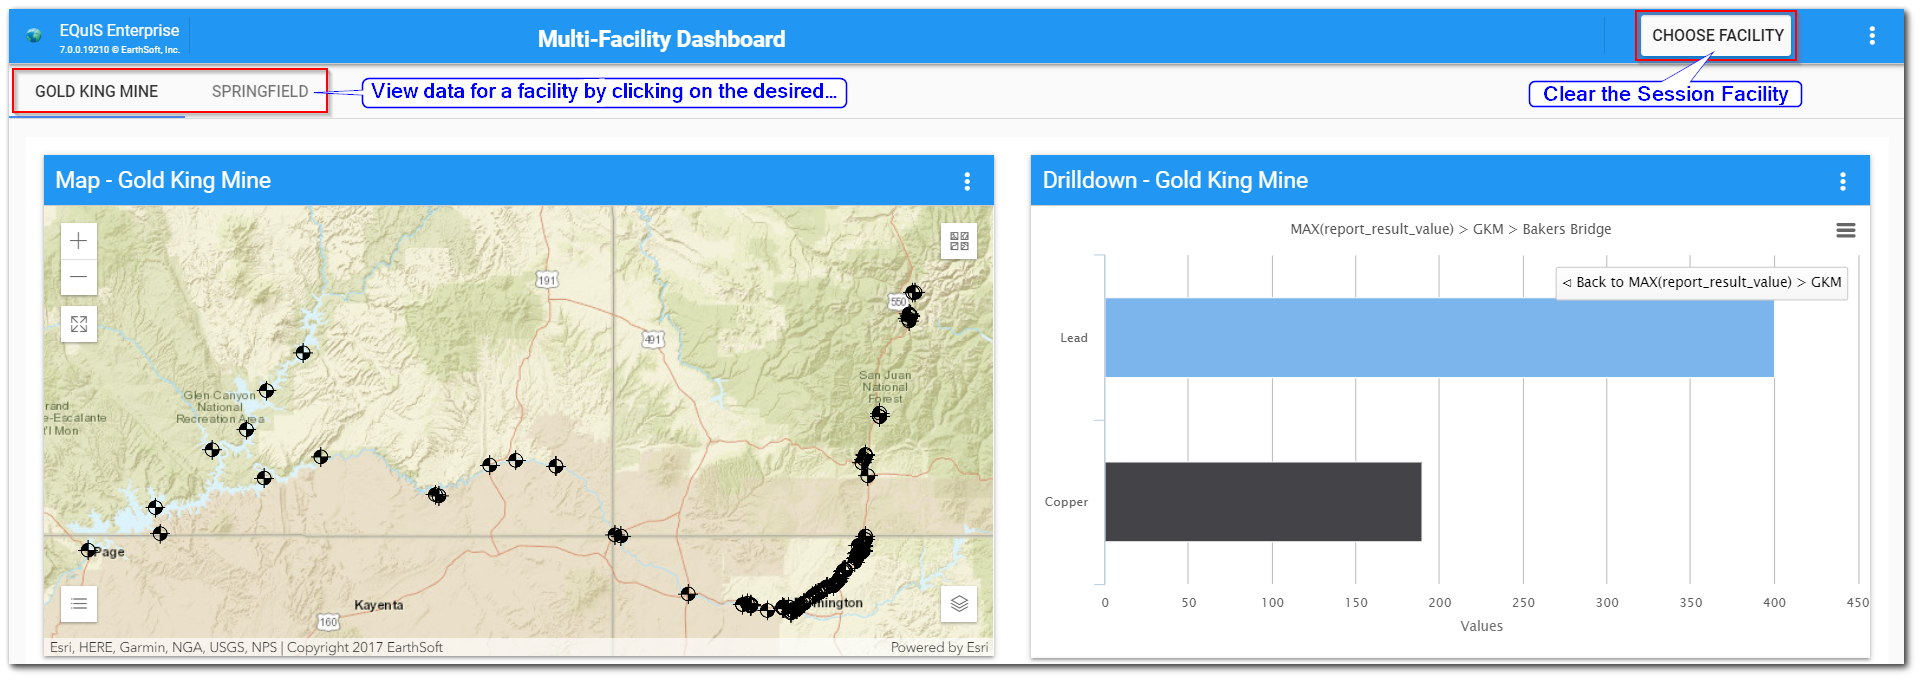
7.If a Session Facility is set, clear the Session Facility Chooser by clicking the minus button.
8.Save the edits to the dashboard.
9.After the dashboard reloads, navigate to the desired facility by clicking the tab for that facility.
Note: Displaying multiple facilities without setting the tabbed layout is possible, but can cause the dashboard to load slower. |
|---|
Multiple Facilities on Map Widget
Display multiple facilities on a Map widget as follows:
1.Select the dashboard to be edited.
2.Open the Dashboard Editor.
3.Add an EZ View widget and a Map widget.
4.Save the edits to the dashboard.
5.Open the Widget Editor for the EZ View widget by clicking the More Options ![]() icon in the upper right corner of the widget.
icon in the upper right corner of the widget.
6.Click on the Report Chooser button to select a report.
7.Browse for the Location Information report.
8.Next to the selected Location Information report, click on the ![]() icon to open the Report Parameter Editor.
icon to open the Report Parameter Editor.
9.Click the Facility Chooser button to select a facility.
10.Select a facility.
11.Expand the Location parameter from the tree structure (as shown in the Report Parameters section of the Report Parameter Editor help documentation).
12.Expand the Individual(s) and/or Group(s) parameters to select the desired locations to display on the Map widget.
13.After the desired locations are selected, click the Save As button to save the selections as a new user report.
14.Repeat Steps 6 – 13 to create additional user reports for the desired facilities.
15.Open the Widget Editor for the Map widget by clicking the More Options ![]() icon.
icon.
16.Select the Layers tab in the Widget Editor.
17.Add the created user reports for each facility by following instructions for the Map widget Layers tab.
18.Save the changes to the Map widget.
19.The map will reload with the different facilities displayed as individual layers that users can access in the legend.
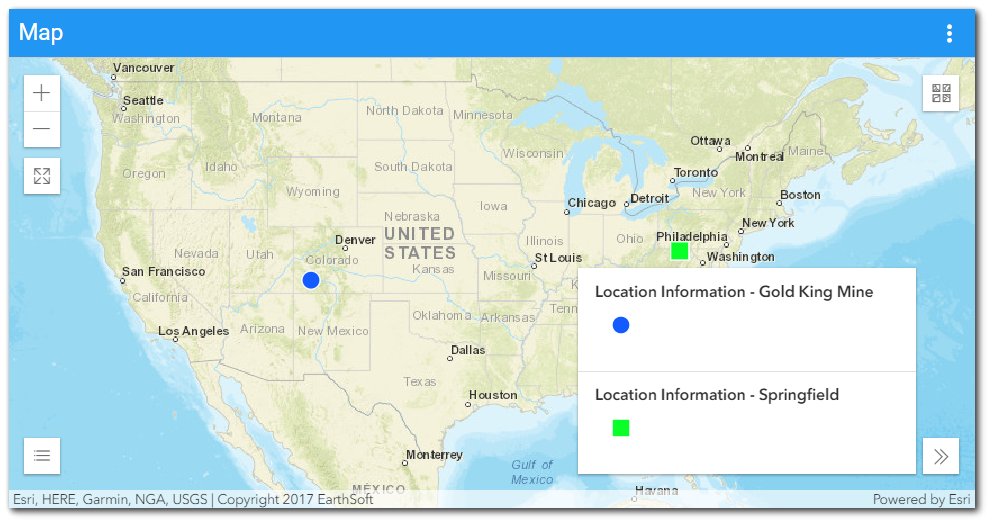
Using a Facility Group in a Time Series Chart Widget
View multiple facilities in a Time Series Chart widget using a facility group as follows:
1.Use an existing facility group or create a new facility group in EQuIS Professional.
2.Select the dashboard to be edited.
3.Open the Dashboard Editor.
4.Add a Time Series Chart widget and an EZ View widget.
5.Open the Widget Editor for the EZ View widget by clicking the More Options ![]() icon in the upper right corner of the widget.
icon in the upper right corner of the widget.
6.Click on the Report Chooser button to select a report.
7.Browse for the Analytical Results II report.
8.Next to the selected report, click on the ![]() icon to open the Report Parameter Editor
icon to open the Report Parameter Editor
9.Click the Facility Chooser button to select a facility.
10.Select the facility group from Step 1.
11.Expand the Location parameter from the tree structure (as shown in the Report Parameters section of the Report Parameter Editor help documentation).
12.Expand the Individual(s) and/or Group(s) parameters to select the desired locations to display in the Time Series Chart and Data Grid.
13.After the desired locations are selected, click the Save As button to save the selections as a new user report.
14.Open the Widget Editor for the Time Series Chart widget by clicking the More Options ![]() icon.
icon.
15.Select the Add Report Data tab.
16.Click on the Report Chooser button to select a report.
17.Select the user report created in Step 13.
18.Select the drop-down arrow in Group Series By.
19.Select FACILITY_CODE.
20.Click the Add Series button.
21.Save the edits to the Time Series Chart widget.
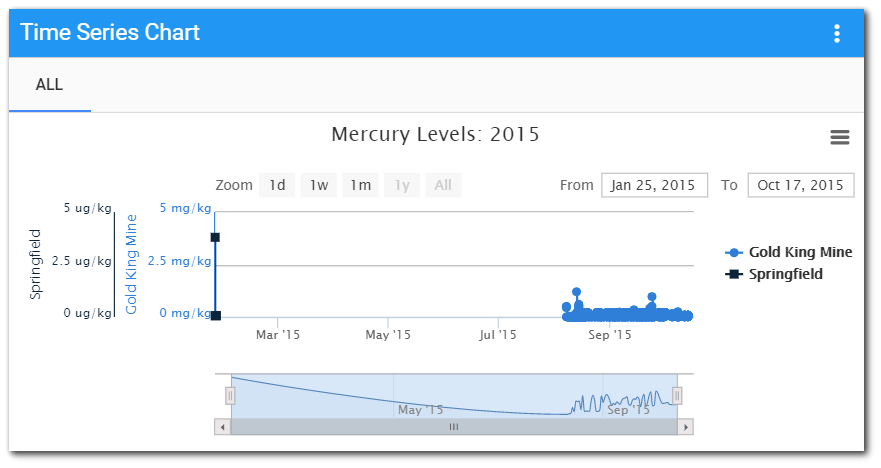
22.The Time Series Chart widget will reload with all facilities displayed on the chart.
23.Reopen the Time Series Chart Widget Editor.
24.Select the Series Data tab.
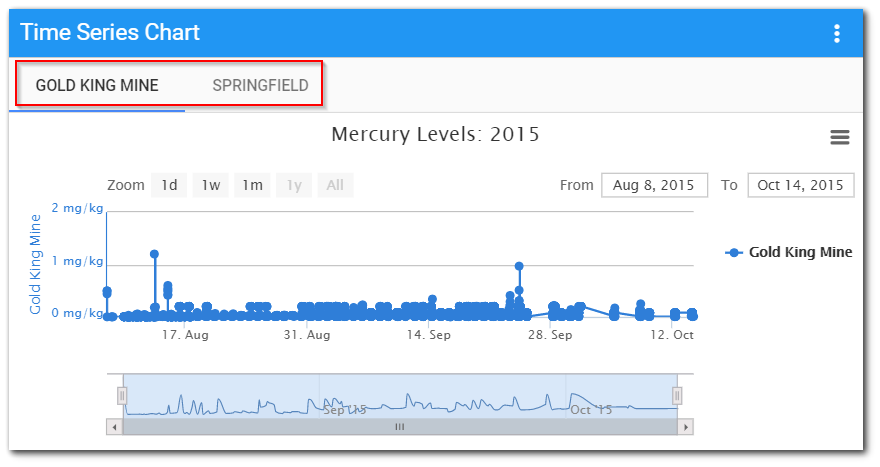
25.In the “Chart/Tab” column, rename “All” to the facility name.
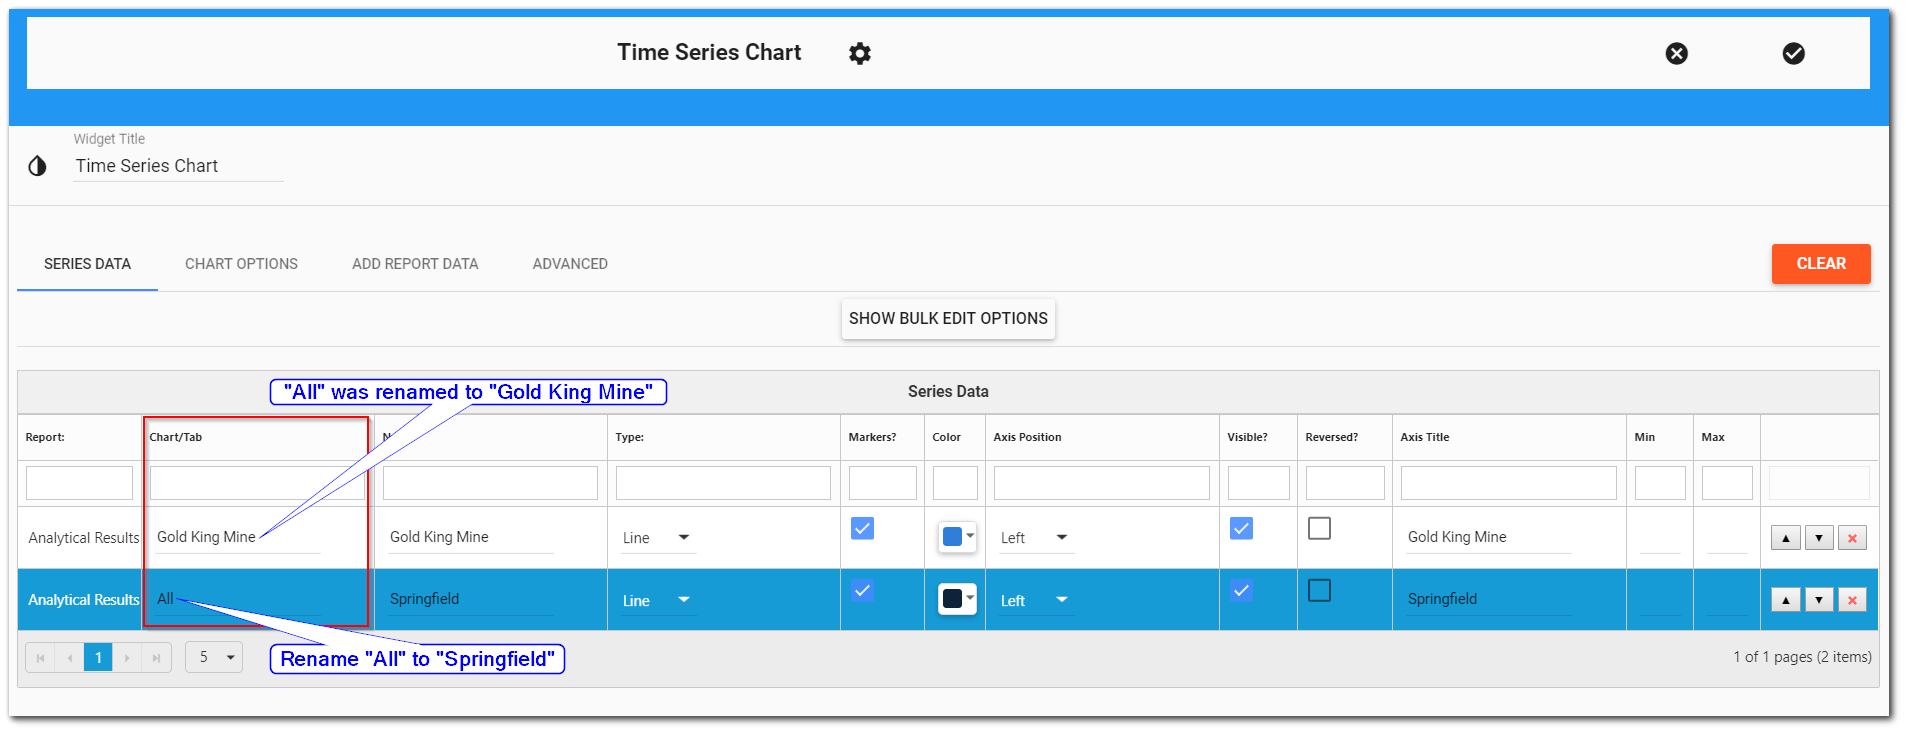
26.Save the edits to the Time Series Chart widget.
27.The Time Series Chart widget will reload, displaying a tab for each facility along with the chart.