•Notes about Table Label Diagrams
•Steps to Manually Convert Table Labels to Graphics (7.24.1 and earlier releases)
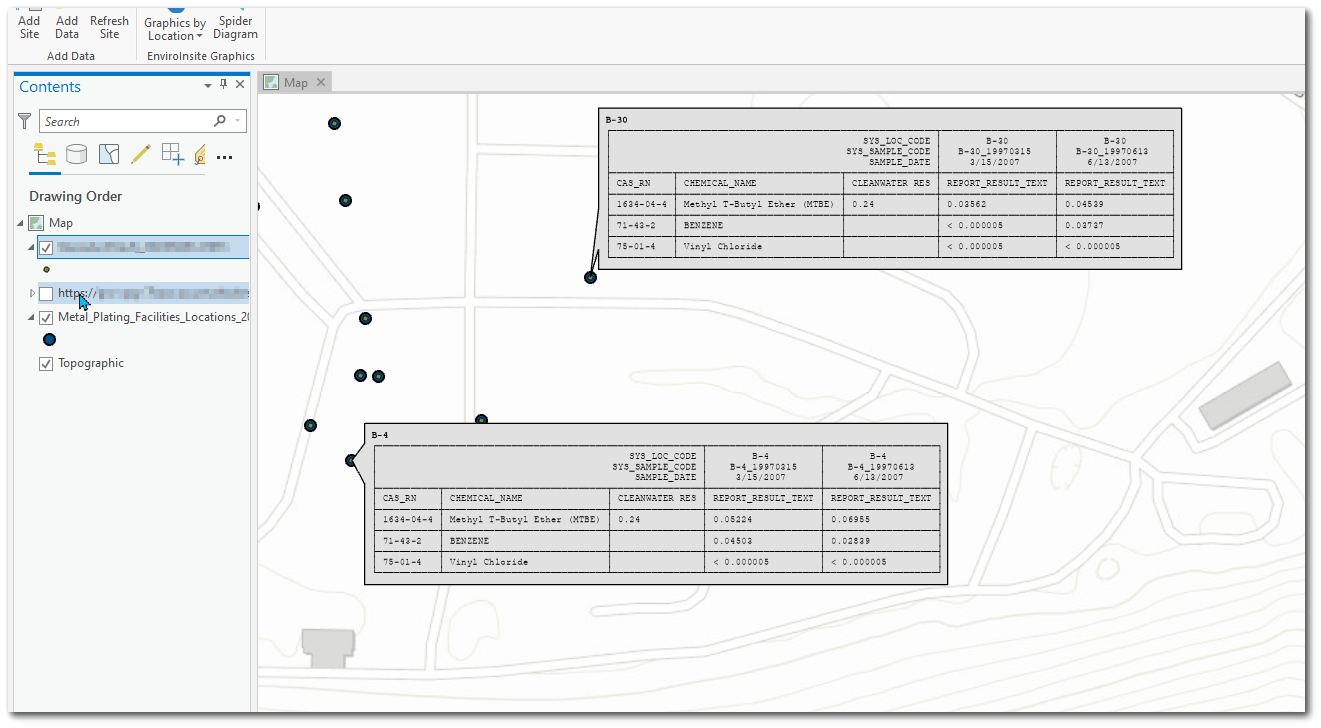
The ArcEQuIS add in for ArcGIS Pro includes the ability to run reports that will display a crosstab table. This allows users to display tables of analytical data from an EQuIS Database on their maps in ArcGIS Pro.
Prerequisites
1.In EQuIS Professional, publish the ArcEQuIS Crosstab Converter Report (EarthSoft.Reports.Library.627608.dll) to the database.
2.Follow instructions on the ArcEQuIS Crosstab Converter Report page to publish a crosstab. Note the requirements that the crosstab configuration uses 'Separate tables by each unique' option set to SYS_LOC_CODE and is published as a grid report.
3.In EQuIS Professional or EQuIS Enterprise, open the published crosstab from Step 2. Create and save a User Report to specify the parameter selections used to generate the Table Labels.
4.In EQuIS Professional or EQuIS Enterprise, open the ArcEQuIS Crosstab Converter report. Select the User Report from Step 3, then create and save a User Report.
Creating a Table Label
Open ArcGIS Pro to a new or existing Map project and connect to an EQuIS Enterprise Site. Add location or other layers using EQuIS Data, if desired.
Add a Table Label as follows:
1.Click the Add Data button (under the ArcEQuIS Tab).
2.Navigate to the correct Facility.
3.Select an ArcEQuIS Crosstab Converter User Report from Step 4 of the previous section, which will display with the following icon: ![]() .
.
Note: The Table Label icon |
|---|
4.Add the report to the map by selecting “Add layer” -> As Snapshot.
5.Starting in 7.24.2, table labels will be added as a graphics layer automatically. Clicking on a table label will display vertices that can be dragged to adjust the size or location of the table label. To convert table labels to a graphics layer in 7.24.1 and earlier, refer to the Steps to Manually Convert Table Labels to Graphics (7.24.1 and earlier releases) section below.
6.Optimize the appearance of the Table Labels.
Depending on zoom level, site distance, table size, etc., initial table label display in ArcGIS Pro may not be optimal.
To alter the appearance and placement of the labels:
1.Zoom in to the appropriate extents.
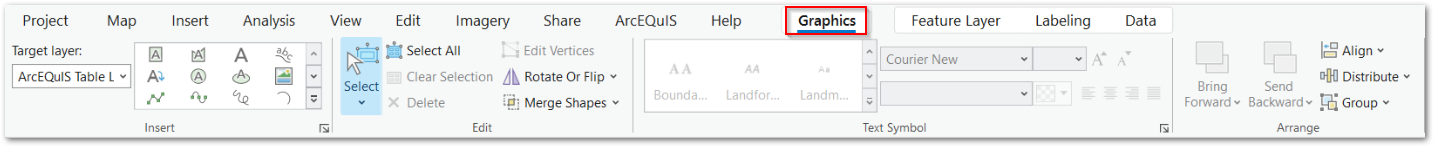
2.Select the "Graphics" tab (shown below) at the top of the window.
3.Click the Select button and select the graphic to modify.
4.Use the tools in the "Graphics" toolbar to change the appearance of the graphic's text and shape. See the following ArcGIS documentation for more information about editing graphics layers:
a.Edit text – ArcGIS Pro | Documentation
b.Modify graphics and text – ArcGIS Pro | Documentation
Notes about Table Label Diagrams
Tables are saved as text in the layer’s attribute table, and are then displayed on the map using the Labeling functionality built into ArcGIS Pro.
Formatting (i.e., bold, italic, underline, font color) defined in the crosstab configuration will be plotted in the text Labels. See ArcGIS documentation for more information on supported formatting.
Limitations
•Plotting as Link will display the labels slowly because of the live connection.
•The refresh may be delayed following edits to the layer contents or display.
•The Table Label icon ![]() will not appear until the second time the report is run in ArcGIS.
will not appear until the second time the report is run in ArcGIS.
•The published crosstab report may only be plotted if the Separate Tables By option of the crosstab configuration is SYS_LOC_CODE.
•The published crosstab report should be published as an igrid.
•The graphic text annotations use extended characters to plot the tables; the tables will only display correctly when using a monospaced font (i.e., Courier New).
•Only text formatting supported by ArcGIS is supported (e.g., cannot set the background color of individual cells in the table).
•There is a limit to the size of crosstab the built-in labeling functionality will display.
Steps to Manually Convert Table Labels to Graphics (7.24.1 and earlier releases)
•In the Map Contents pane:
Step 1: Right-click on a layer that includes table labels.
Step 2: Select "Convert Labels".
Step 3: Select "Convert Labels to Graphics".
Repeat these steps for additional layers.
