ArcEQuIS supports dynamically generating the following EnviroInsite graphics in PDF output by clicking locations (aka points) on the map:
Before generating these graphics by location, EnviroInsite and PDF prerequisites are required (in addition to those required for ArcGIS Pro and the ArcEQuIS add-in).
This functionality is accessed with the the Graphics by Location button, which can be found in the EnviroInsite Graphics section of the ArcEQuIS ribbon.
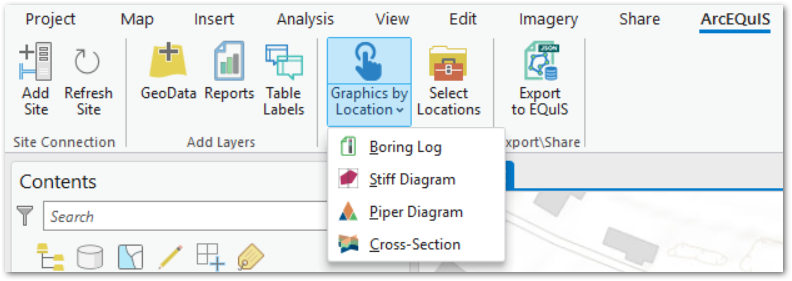
Notes: •The Graphics by Location button will not be active if a facility location layer has not been added. •All active buttons will remain active if a site is removed. |
|---|
Boring Logs
Generate boring logs in ArcEQuIS by following these steps:
1.In ArcGIS Pro, open a new or existing Map project and connect to an EQuIS facility.
2.Use the Add EQuIS Geospatial Data button on the ArcEQuIS ribbon to add a Locations Point or Polygon layer to the map.
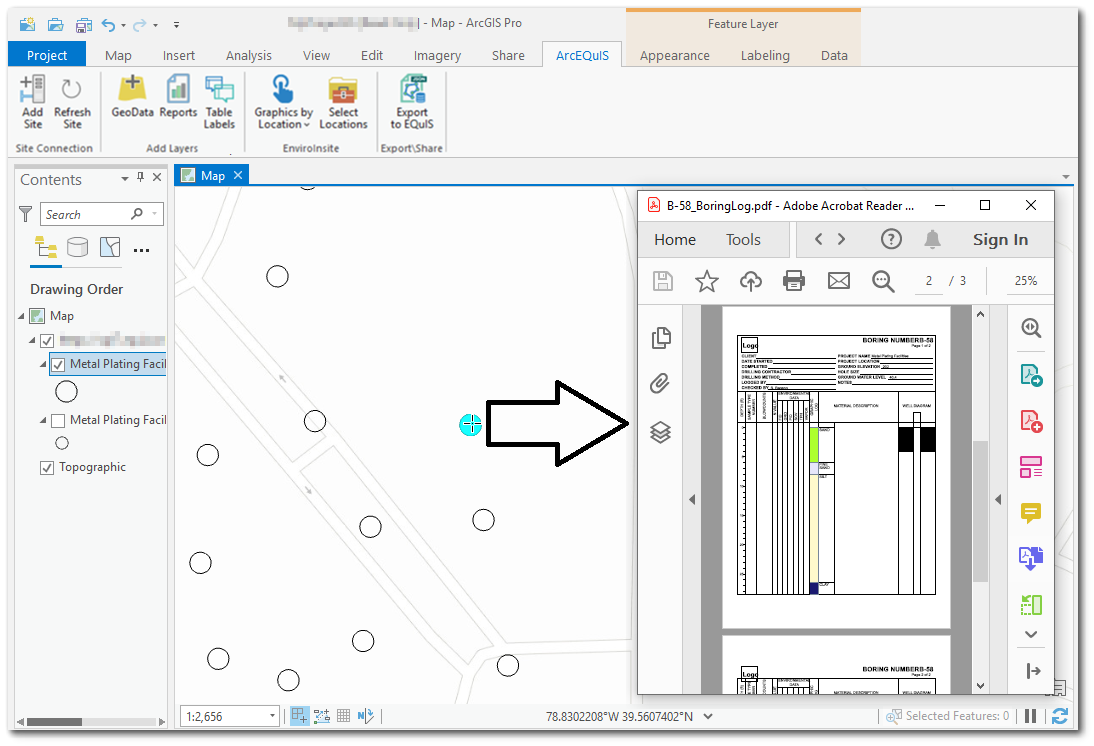
3.Navigate to the Graphics by Location button on the ArcEQuIS ribbon. Click the drop-down arrow and select Boring Log.
4.The cursor should change to the crosshair ![]() icon. Click a location to generate a boring log as a PDF file for that location. Boring logs will automatically be saved with the following naming convention:
icon. Click a location to generate a boring log as a PDF file for that location. Boring logs will automatically be saved with the following naming convention:
[SYS_LOC_CODE]_BoringLog.pdf
Notes: •When the zoom resolution renders multiple locations as a single point or multiple locations are overlapping, selecting the single point will generate boring logs for all the locations. •If a boring log is generated for the same location multiple times (without changing the file location or name of the existing boring log), the new boring log file will overwrite the existing boring log file. |
|---|
Stiff Diagrams
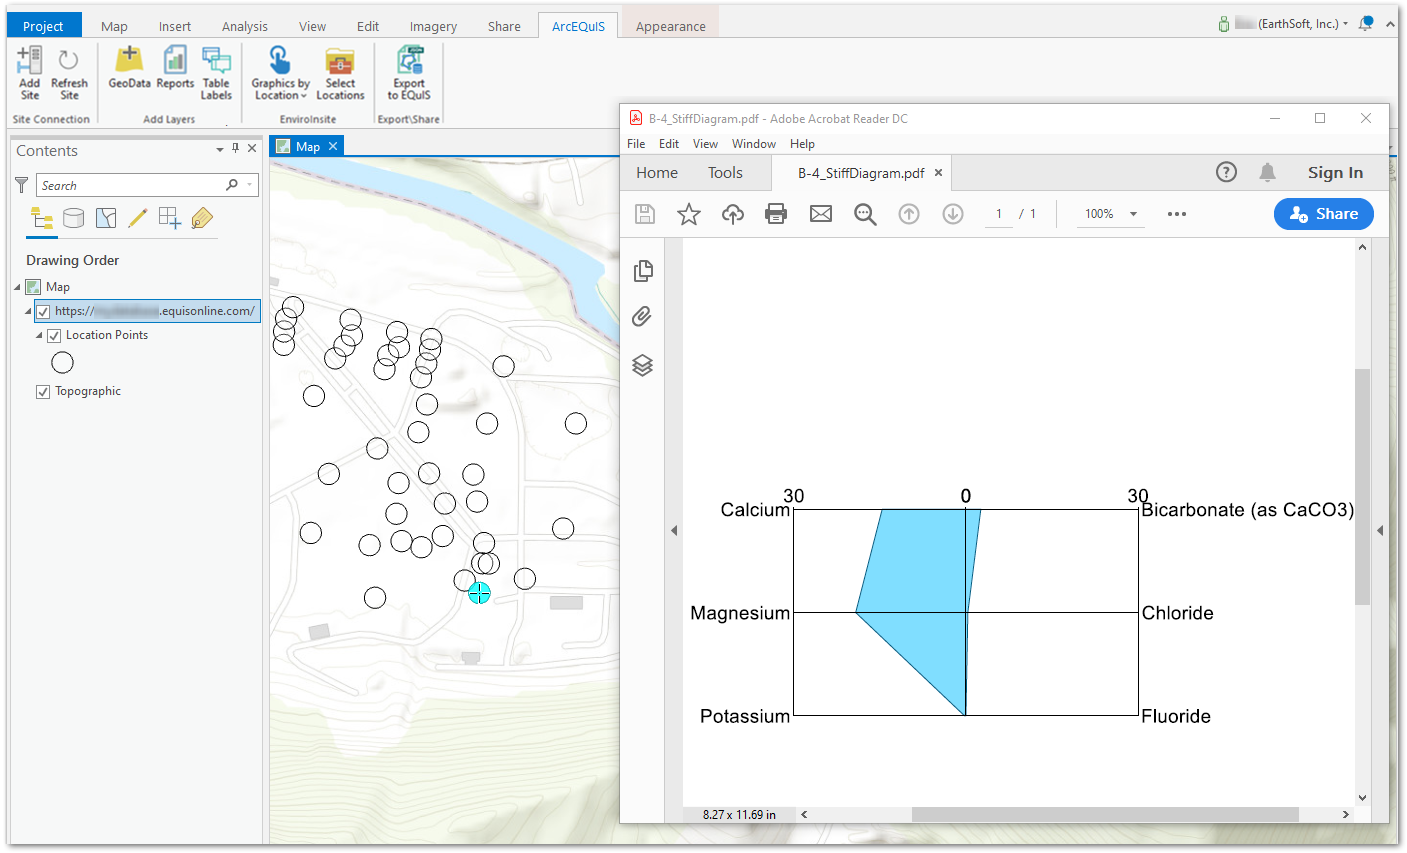
Use the same steps outlined above for boring logs to generate a Stiff diagram, but select Stiff Diagram in the Graphics by Location drop-down. Select a location to generate a Stiff diagram as a PDF file for that location. The PDF file will automatically be saved with the following naming convention:
[SYS_LOC_CODE]_StiffDiagram.pdf
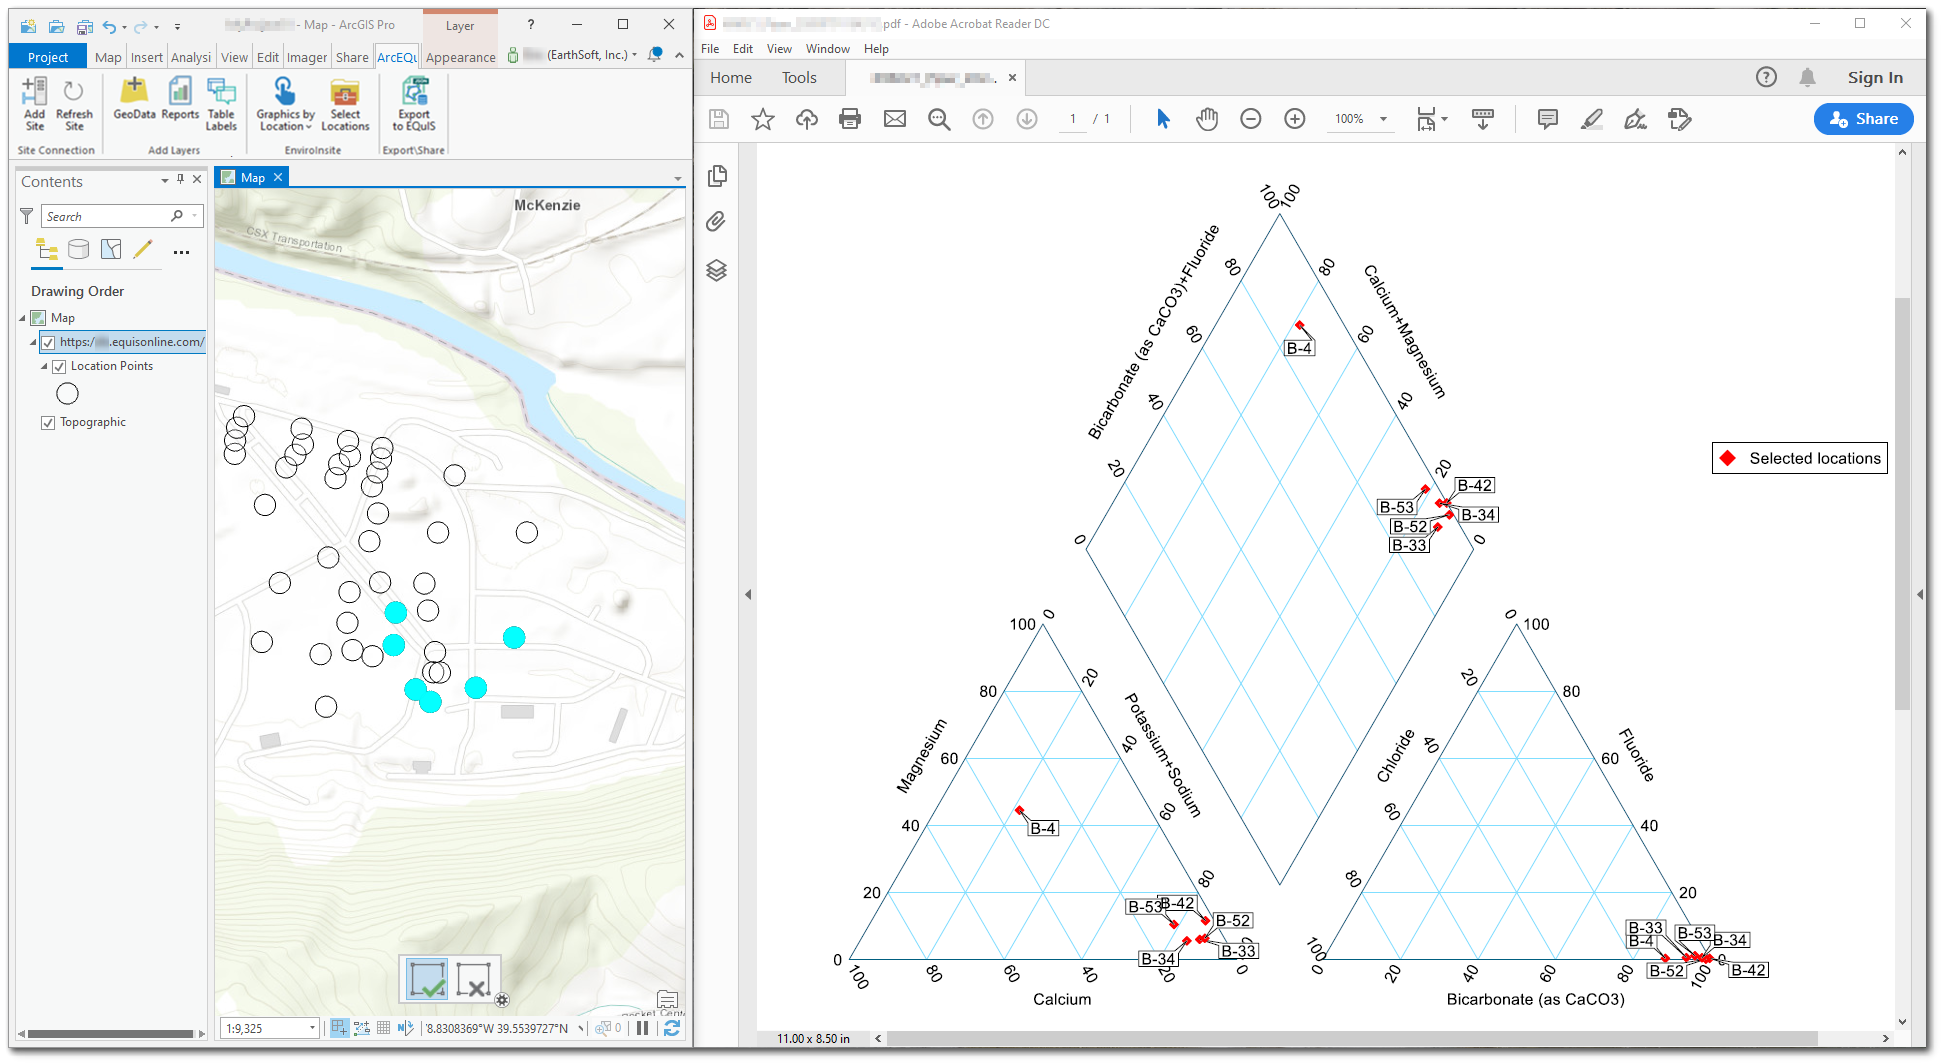
Piper Diagrams
Piper diagrams can be generated using the same steps as boring logs and Stiff diagrams, except that multiple locations can be selected to add to the Piper diagram. The steps to generate a Piper diagram are as follows:
1.In ArcGIS Pro, open a new or existing Map project and connect to an EQuIS facility.
2.Use the Add EQuIS Geospatial Data button on the ArcEQuIS ribbon to add a Locations Point or Polygon layer to the map.
3.Navigate to the Graphics by Location button on the ArcEQuIS ribbon. Click the drop-down arrow and select Piper Diagram.
4.The cursor should change to the crosshair ![]() icon. Click the locations(s) to include in the Piper Diagram. Two small curved lines will be displayed at each of the selected locations as shown in this example point:
icon. Click the locations(s) to include in the Piper Diagram. Two small curved lines will be displayed at each of the selected locations as shown in this example point:
![]() .
.
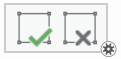
5.When all locations have been selected, click the Finish button (left, green check). To change the selected locations, click the Cancel button (right, grey x) and make new selections.
6.Once the Finish button is clicked, a new Piper diagram will be generated as a PDF file for the selected locations. The PDF file will automatically be saved with the following naming convention:
[FACILITY_ID]_Piper[date-time string of current time].pdf
Notes: •There is a known issue when clicking the Finish button without making selections. If nothing is selected before the Finish button is clicked, ArcGIS Pro will crash. |
|---|
Cross-Sections
Geological cross-section diagrams can be generated using the same general steps as other Graphics by Location, however, the user must draw a line on the map to identify the cross-section to generate. The steps to generate cross-sections are as follows:
1.In ArcGIS Pro, open a new or existing Map project and connect to an EQuIS facility.
2.Use the Add EQuIS Geospatial Data button on the ArcEQuIS ribbon to add a Locations Point or Polygon layer to the map. The Facility Locations layer needs to be the top layer in the Contents Pane.
3.Navigate to the Graphics by Location button on the ArcEQuIS ribbon. Click the drop-down arrow and select Cross-Section.
4.Draw the line to use to create the cross-section on the map. Note that the line may only contain up to 6 points (2 end points and up to 4 intermediate points). To end the cross-section segment, double-click the end point.
5.Once the endpoint is double-clicked, a message will appear stating “Graphic is being generated”. A new cross-section diagram will be generated as a PDF file. The file will automatically be saved with the following naming convention:
[FACILITY_ID]_crosssection_[date-time string of current time].pdf
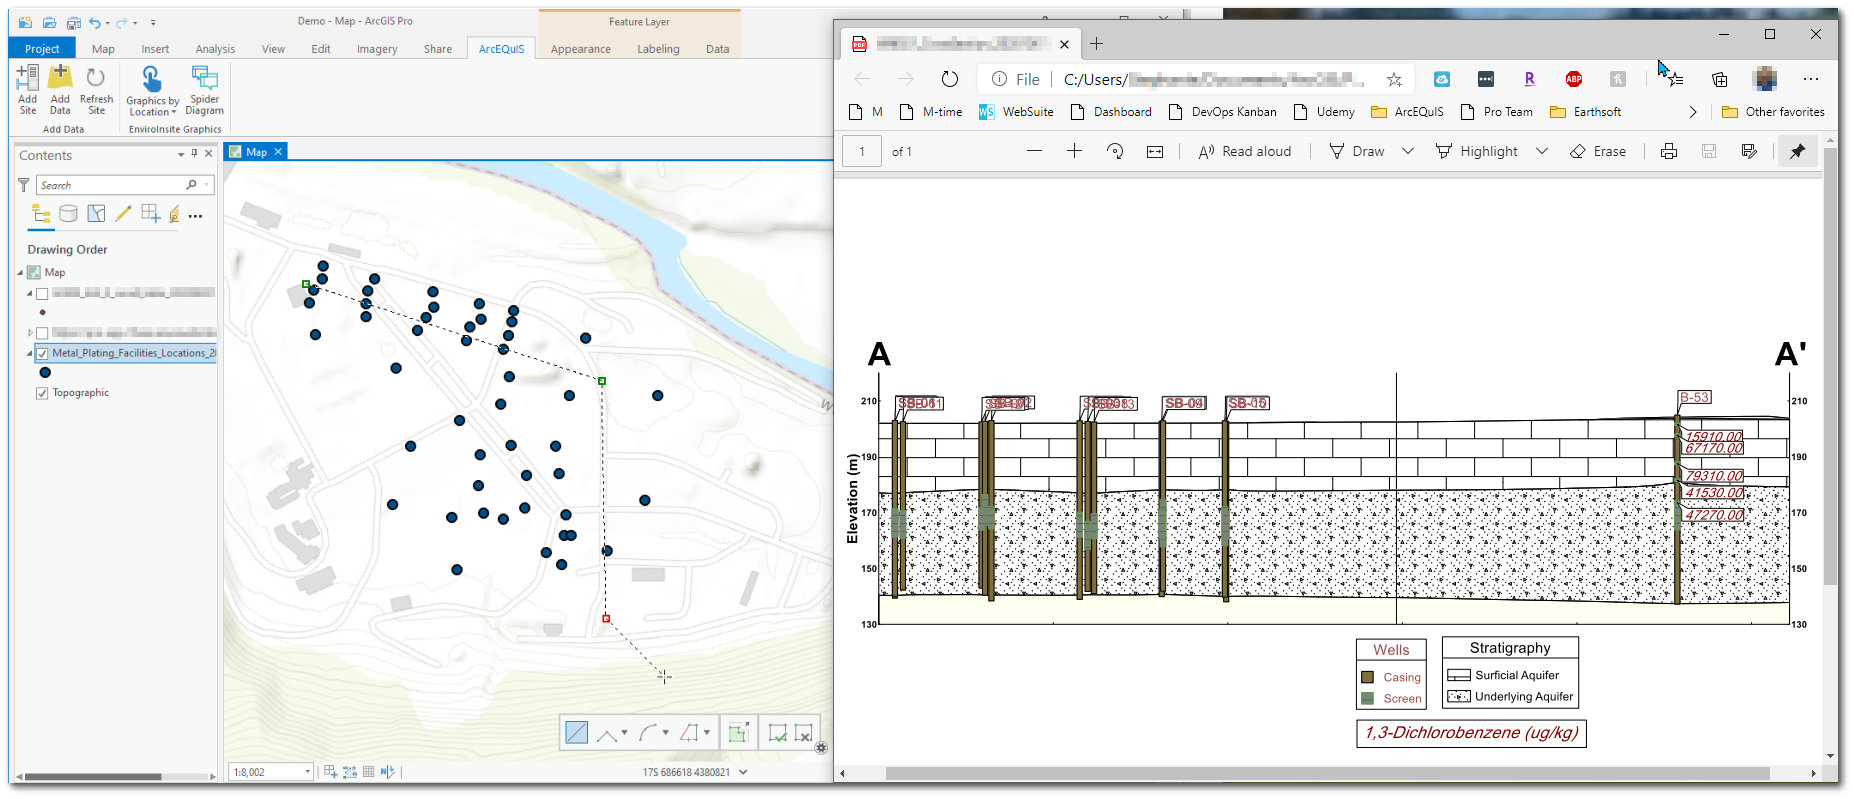
The cross-section will by default use the ArcGIS Aerial Photo when generating the overview map in the diagram. In the example template, any wells within 25 feet of the cross-section line (measured once converted to UTM coordinates) will be displayed on the cross-section. This buffer distance can be set in the template when edited or created in EnviroInsite.
Notes: •A large number of locations may slow down the generation of the cross-section PDF file. •The cross-section may not generate if it is not zoomed to the extent of the location point layer. To zoom to the extent of the layer, right-click on the layer and select “Zoom to extent”. |
Troubleshooting
If a "Graphics are being generated" message is displayed, but no graphics are rendered, please try the following:
1.Wait. Depending on the number of locations in the database, graphics may take several minutes to be generated.
2.Confirm that all the conditions covered in the Prerequisites section above have been met. Specifically, that the template file is appropriately named and located, and that EnviroInsite has been installed on the Enterprise server.
If ArcEQuIS exports a graphic, but it is blank or missing data, the underlying data required to generate the figure may not be present in the database. Check the underlying "EnviroInsite..." report that is being used in EQuIS Professional, and update the template files (covered in the Prerequisites section above) accordingly.
For Piper diagrams, ensure that the three analytes used in the report have data for the selected location(s), and that equivalent weights for each analyte are populated in the RT_ANALYTE_DETAIL.EQUIVALENT_WEIGHT fields. To ensure all the required data are present, run the Analytical Results II report for the analytes where RT_ANALYTE_DETAIL.EQUIVALENT_WEIGHT is populated. Then review this report output to ensure the following:
•At least six analytes (three cations and three anions) are chosen that contain data from the same sample.
•DT_RESULT.RESULT_UNIT cannot be null for any of the selected analytes.
•DT_TEST.FRACTION should match across the selected analytes and this FRACTION should be selected as a parameter.
•Duplicate records do not exist in RT_ANALYTE.CHEMICAL_NAME for any of the selected analytes.
For cross-sections, make sure that the extents (X_MIN, X_MAX, Y_MIN and Y_MAX) in the DT_FACILITY table are set correctly. These are used as the extents for the inset overview map, and if they are incorrect can result in an invalid output.