Posted data values represent one of the simplest ways of displaying data. Queries are applied and the type of data (average, minimum, maximum, first, or last) to be posted is selected. The value is then posted with a leader pointing to the location (in plan view) or the center of the screen interval (in 3D view).
Click either Plot > 2D Data or Plot > 3D Data from the main menu and select Post. The Locations dialog box opens. Modify the properties of the locations plot on the following tabs as desired:
Select the Apply button to see changes before saving. Click the OK button to save changes.
Modifications to the number formatting, including a thousand separator, can be made via the Edit > Localization from the main menu. This will open the Localization dialog box where these properties can be set.
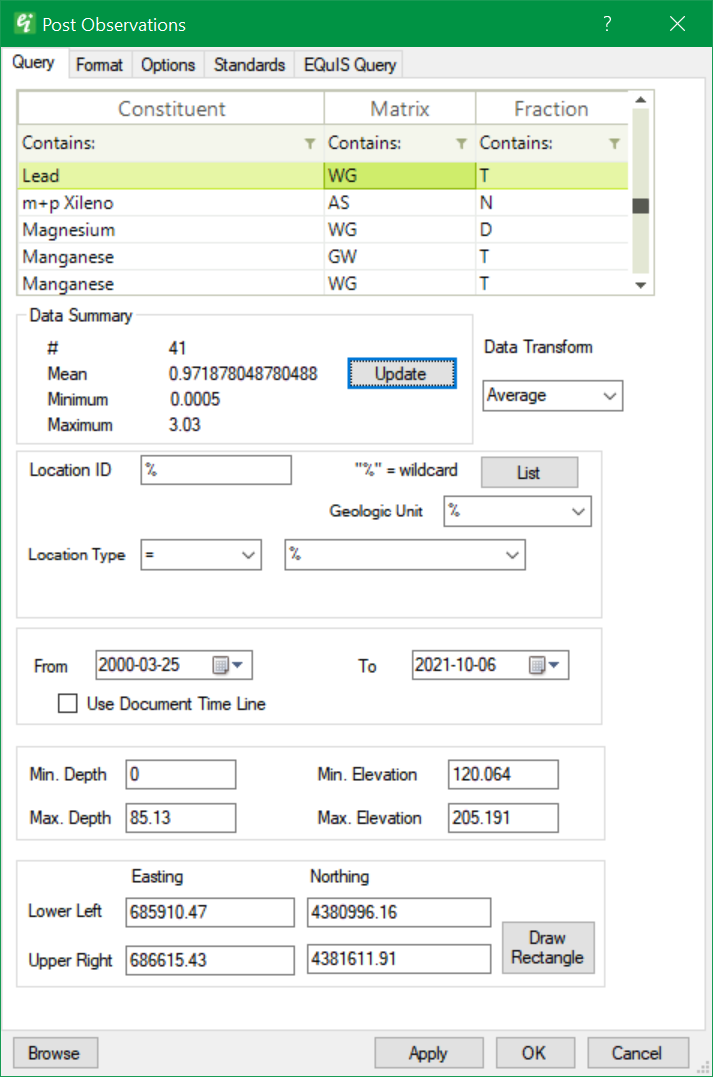
Constituent List – Select the Constituent (Analyte or Water Level), Matrix, and Fraction values to be plotted.
Data Summary – Click the Update button to get statistics (count, mean, minimum, and maximum) of the queried data.
Data Transform – Select from either Average, Minimum, Maximum, First, or Last to modify the queried result transformation.
Location ID – Enter value to filter by Location ID. Text fields in this section can use "%" as a wildcard.
List – Click List button to select specific locations to be plotted. List does not need to be defined if all locations are to be plotted.
Geologic Unit – Enter value to filter by geologic unit.
Location Type – Set to equal or exclude a specific location type.
From and To – Select a start and end date to filter the dataset, or check Use Document Time Line.
Min. Depth and Max. Depth – Enter minimum and maximum depth values to filter by sample depth.
Min. Elevation and Max. Elevation – Enter minimum and maximum elevation values to filter by sample elevation.
Coordinates (Lower Left/Upper Right and Easting/Northing) – Edit selection-rectangle coordinates, or click the Draw Rectangle button to redefine.
Draw Rectangle – Click the Draw Rectangle button to visually define the selection-rectangle coordinates.
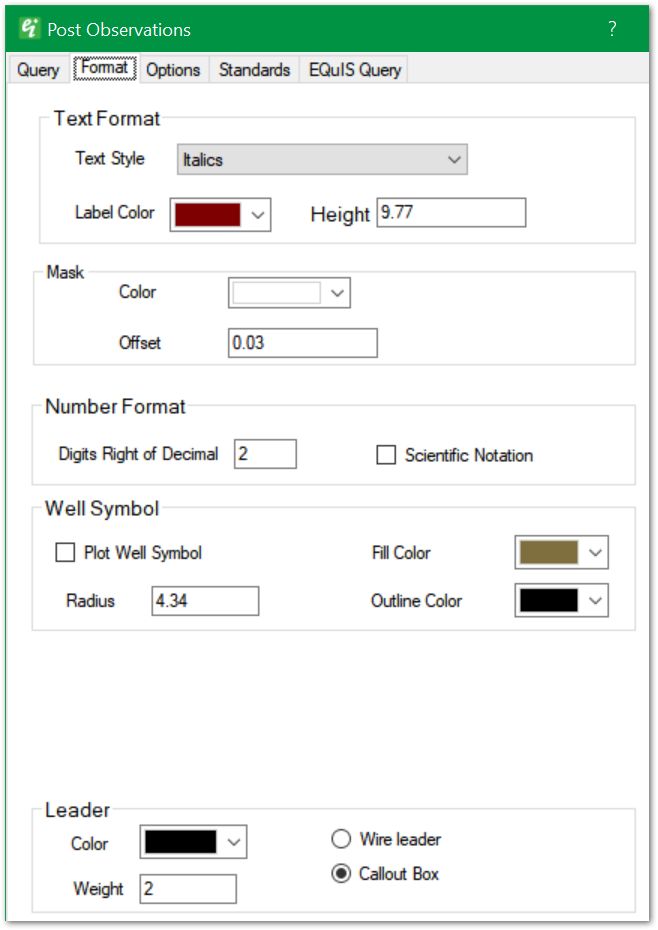
Text Style – Select the text style. Text styles are defined as document properties.
Label Color – Select the label color.
Height – Enter text height in real-world coordinates.
Mask – The label's background mask is a font outline to enhance the visibility of text strings drawn over busy background images.
Color – Select background mask color.
Offset – Specify the mask width, expressed as a fraction of the specified text height.
Number Format > Digits Right of Decimal – Set the number of decimal places to display.
Number Format > Scientific Notation – Check to use scientific notation in representing the measure values.
Well Symbol > Plot Well Symbol – Check to plot location symbol
Well Symbol > Radius – Specify the location symbol radius in real-world coordinates.
Well Symbol > Fill Color and Outline Color – Select the symbol fill and outline colors.
Leader Color – Select the leader line color.
Leader Weight – Enter the leader line weight in hundreds of millimeters (mm).
Leader Style – In the right side of the Leader section, select the leader style (Wire leader or Callout Box).
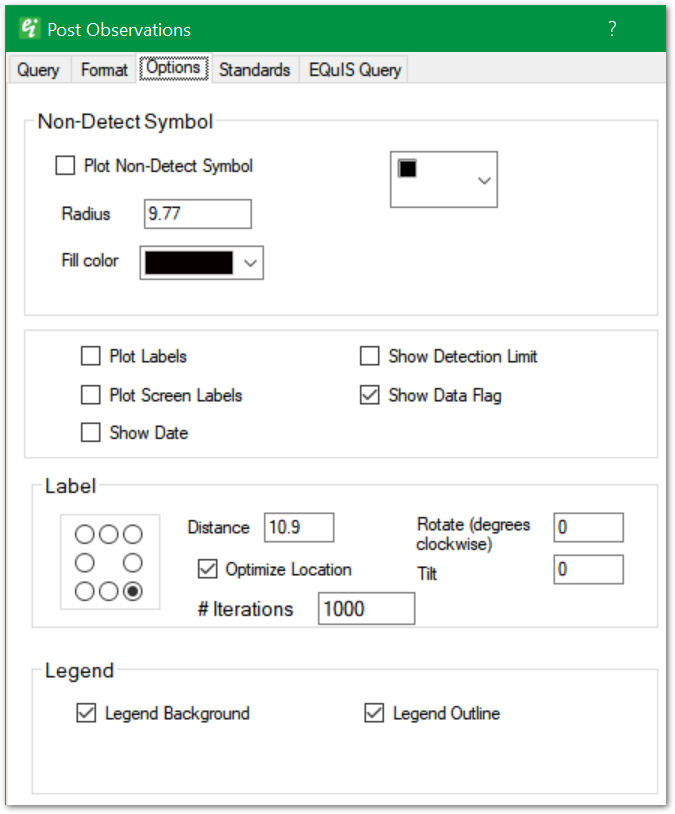
Non-Detect Symbol – Options include a non-detect symbol in the right pane, the Plot Non-Detect Symbol toggle (described below), a Radius option, and a Fill color option.
Plot Non-Detect Symbol – Check to set the location symbol to be used when a measured result is a non-detect. If average was selected as the query feature, then the detect flag will not be used unless all of the values used in averaging at a particular point are non-detects.
Plot Labels – Check to plot the location ID.
Plot Screen Labels – Check to plot the interval ID.
Show Date – Check to show the measurement date.
Show Detection Limit – Check to show the detection limit.
Show Data Flag – Check to show data quality flags.
Label – Use the radio-button grid in the left portion of the Label section to select a relative position of the label in relation to the location.
Label Distance – Specify the initial distance between the measurement location and the value label.
Label Optimize Location and # Iterations – Check to optimize label position for all locations in the query. Users can aslo set the number of iterations for optimization process (1000 by default). More optimization will improve results but take longer.
Label Rotate – Specify the label rotation in degrees clockwise.
Label Tilt – Specify the tilt rotation in degrees. Users are advised to not set the Mask offset to 0 in the event of a non-0 tilt.
Legend Background and Legend Outline – Check to draw a legend background and/or outline, respectively.
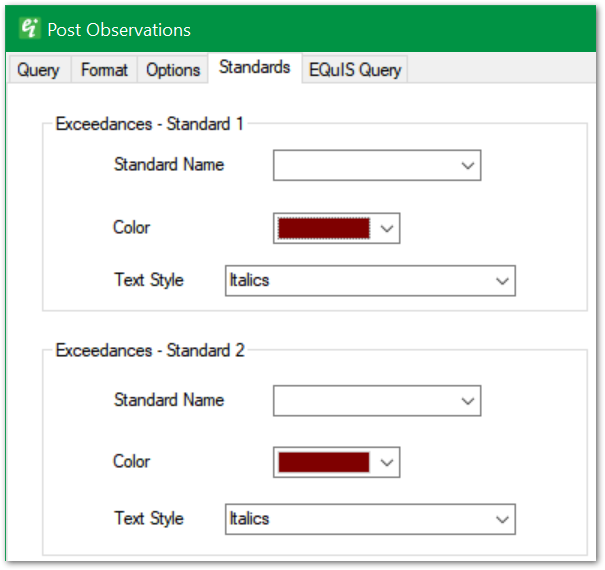
For each Exceedances - Standard section:
Standard Name – Select regulatory standard for comparison to measured values.
Color – Select text color to indicate exceedances of standard.
Text Style – Select text style to indicate exceedances of standard. Text styles are defined as document properties.