Classed post plots are a powerful tool for understanding the spatial distribution of particular constituents. Queries are applied to select data. In plan view classed post plots, color-coded symbols posted at monitoring locations that are based on grouping the data into discrete classes (bins). The color and radius of the symbol are dependent on the value of the selected constituent at that monitoring location. In three-dimensional classed post plots, the well screen or measurement interval is colored according to the corresponding value measured at that point.
Click either Plot> 2D Data or Plot> 3D Data from the main menu and select Classed Post. The Classed Post dialog box opens. Modify the properties of the classed post plot on the Query tab, Intervals tab, Options tab, and EQuIS Query tab as desired. Click the OK button to save changes.
Note: The sample depths will plot from either the DT_WELL_SEGMENT or DT_SAMPLE table, based on what is set for the matrix in the Sample Interval Horizon tab of the EQuIS Setup. |
Query Tab
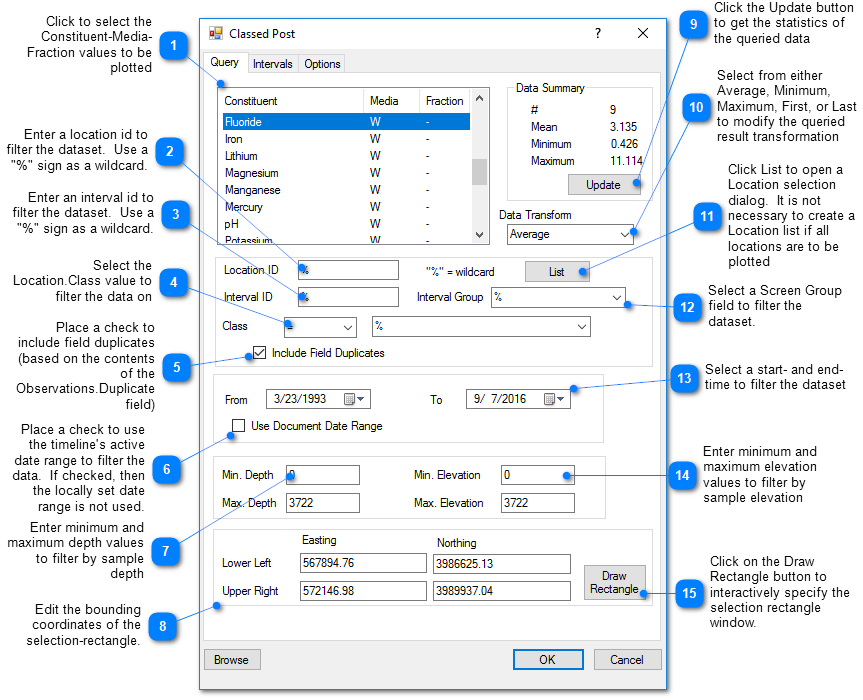
Note: For minimum and maximum depth values (Annotation 7 above), the following must be valid: Min. Depth <= Sample Start Depth < Max. Depth OR Min. Depth < Sample End Depth <= Max. Depth |
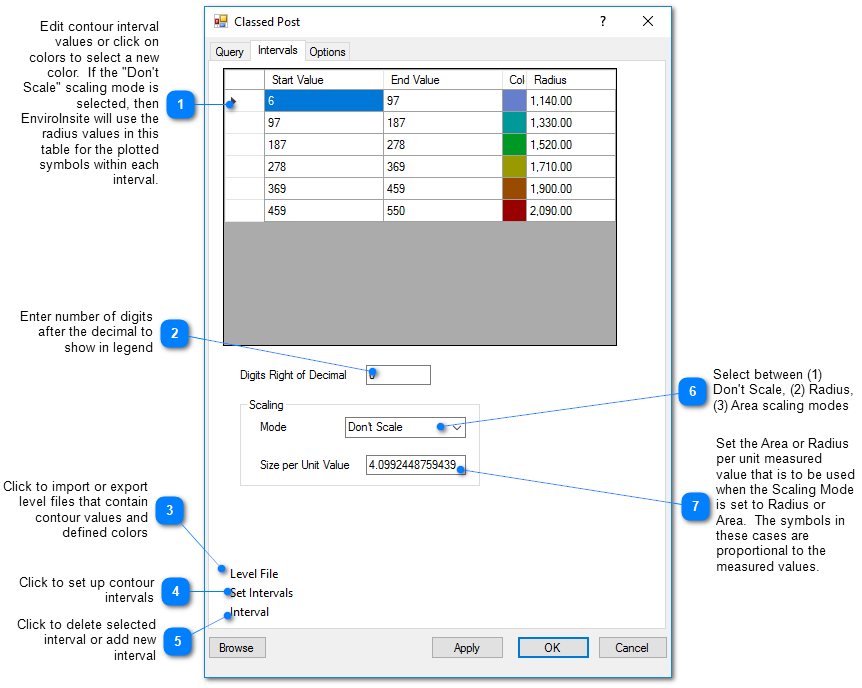
Intervals Tab
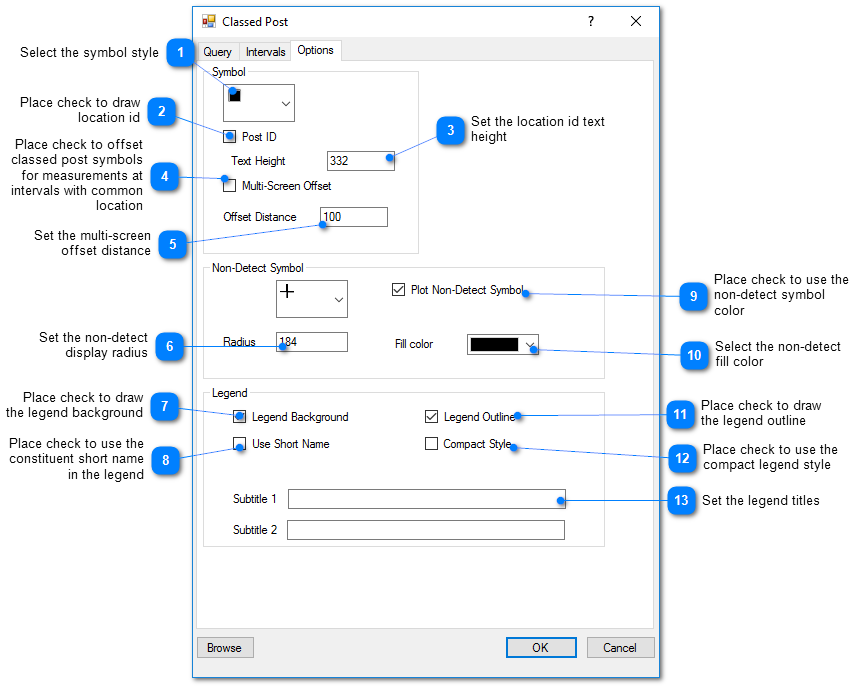
Options Tab