The Wind Rose Chart widget is designed to show wind data in a wind rose format. It does not provide individual wind speeds. To see individual wind speed data, use the Live Chart, Live Table or Historical Chart widgets, or run the Date Series Data Agent.
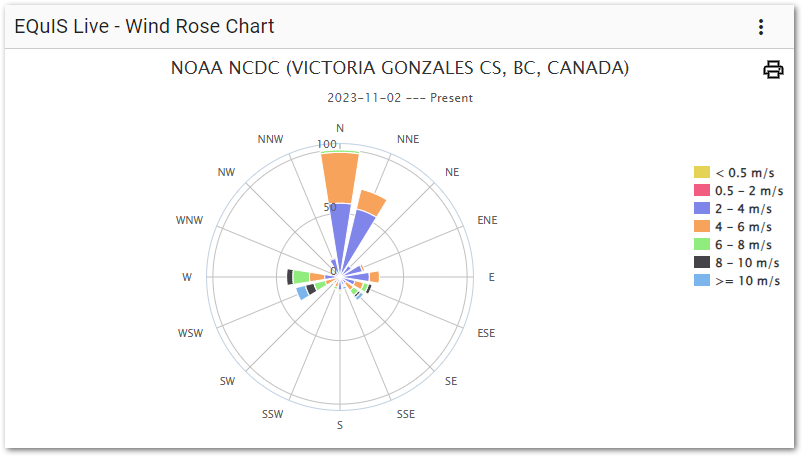
Legend
The legend shows the wind speed ranges displayed on the chart. Clicking an interval in the legend will hide the data in that wind speed interval, which will cause the chart to recalculate. The chart displays either a count of the wind speeds in that range or stacked percentages of wind speeds, depending on the option selected in the Widget Editor.
Cardinal Directions/Degrees
All directional measurements are based on a circle with North = 0 degrees, East = 90 degrees, and so on. Each measurement is sorted into a range that is assigned a direction, increasing by 22.5 degrees each time, to represent the 16 directions on the chart. For example, any measurement within 0-22.5 degrees would appear in the North section of the chart.
Tooltip
When the cursor is placed over a section of the chart, a tooltip will show the count of readings within that wind speed range and what percentage of the total readings in that direction that section entails.
The option to print the chart, as seen in the widget, can be accomplished by clicking the Print ![]() button in the top-right corner of the chart.
button in the top-right corner of the chart.
Widget Editor
To open the Widget Editor, select the More Options ![]() icon in the upper right corner of the Wind Rose Chart widget to open the drop-down menu and then select the Edit menu option. The widget properties are divided into two tabs: Loggers and Options.
icon in the upper right corner of the Wind Rose Chart widget to open the drop-down menu and then select the Edit menu option. The widget properties are divided into two tabs: Loggers and Options.
Widget Title – By default, the widget title is EQuIS Live - Wind Rose Chart. The title can be modified.
Widget Color – The color of the widget can be changed using the Change Widget Theme![]() icon to the left of the widget title.
icon to the left of the widget title.
Help – The Help ![]() icon connects to the online documentation related to the specific widget.
icon connects to the online documentation related to the specific widget.
Copy – Select the Copy Settings ![]() icon to copy the settings from another widget of the same type. See the Copy Widget Settings article for more information.
icon to copy the settings from another widget of the same type. See the Copy Widget Settings article for more information.
Cancel – Select the Close without Saving ![]() button to exit the Widget Editor without saving changes.
button to exit the Widget Editor without saving changes.
Save – Changes will be applied to the widget by clicking on the Save ![]() button. The Widget Editor screen will close after the save operation is complete.
button. The Widget Editor screen will close after the save operation is complete.
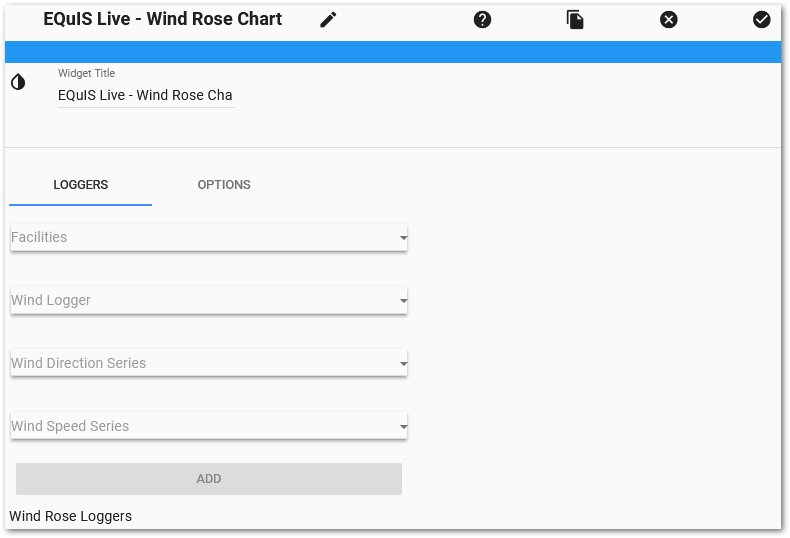
Loggers Tab
To add series to the chart, select the appropriate parameters:
•Facilities – Select a facility from the drop-down list or choose No Facility.
•Wind Logger – Shows what loggers are available within the selected facility.
•Wind Direction Series – For the logger selected above, select the data series that defines the wind direction.
•Wind Speed Series – For the logger selected above, select the data series that defines the wind speed. Only series with a SERIES_UNIT equal to one of the following (case insensitive) values are displayed: 'fps', 'ft/s', 'ft/sec', 'm/s', 'm/sec', 'km/h', 'km/hr', 'kph', 'knots', 'mph'.
Click the Add button after choosing the desired parameters to include for the series in the chart. The Wind Rose Loggers list shows what series will be displayed in the chart. Select a series in the list and click the Remove Selected button to remove a series from the chart.
Options Tab
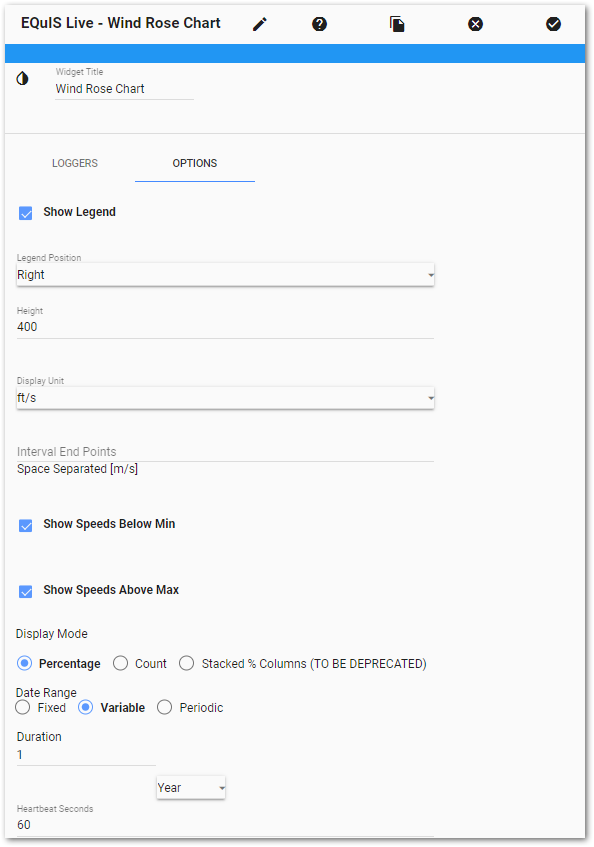
The following parameters for the table can be set on the Options tab:
•Show Legend – Show or hide the legend on the chart.
•Legend Position – Display the legend on the left, right, or bottom of the chart area.
•Chart Height – Indicates the desired chart height.
•Display Unit – Data will be converted to this unit when displayed on this chart.
•Interval End Points – Used to manually set the intervals (in m/s) used in the chart and displayed in the legend. For example, entering "2 4 6 8" will group data into five intervals: < 2, 2-4, 4-6, 6-8, and ≥ 8.
•Show Speeds Below Min – When unchecked, hides data readings that fall below the lowest wind speed interval in the legend. The minimum interval defaults to 0.5 m/s or is set manually in the Interval End Points parameter.
•Show Speeds Above Max – When unchecked, hides data readings that are higher than the highest wind speed interval in the legend. The maximum interval defaults to 10 m/s, or is set manually in the Interval End Points parameter.
•Display Mode – Choose one of the three options:
•Percentage – Displays each segment on the chart as a percentage of the total reading.
•Count – Displays each segment on the chart as a count of the data.
•Stacked % Columns – Displays each segment on the chart as the percentage of that wind direction, totaling 100%. This option will be removed in a future update of EQuIS Live as it obfuscates data.
•Date Range – Choose one of three options:
•Select Fixed to set a fixed date range using Start Date/Time and End Date/Time. If End Date is not set, the chart will default the end date to the present.
•Select Variable to choose a duration from the present for which the chart will display data (in Variable Start Date). Enter a number for the duration and select the appropriate unit (year, month, week, day, hour, minute). For example, if the duration is 1 hour and it is 09:35, the Variable option will return values from 08:35 up to 09:35.
•Select Periodic to choose a duration from the last full period (year, month, week, day, hour, minute). Enter a number for the duration and select the appropriate unit. For example, if the duration is 1 hour and it is 09:35, the Periodic option will return values from 08:00 up to 09:00 as that is the last full hour.
•Heartbeat Seconds – Used to set a refresh timer for the widget in seconds. Setting it to zero or using a "fixed date range" will disable the timer.