The EQuIS Live - Live Table widget shows real-time data retrieved from the selected loggers and series. This widget auto-updates at set intervals (either user-specified or based on TRANSMIT_PERIOD_S in DT_LOGGER). The Live Table widget differs from the Live Chart widget in that it only shows the most recent set of data collected.
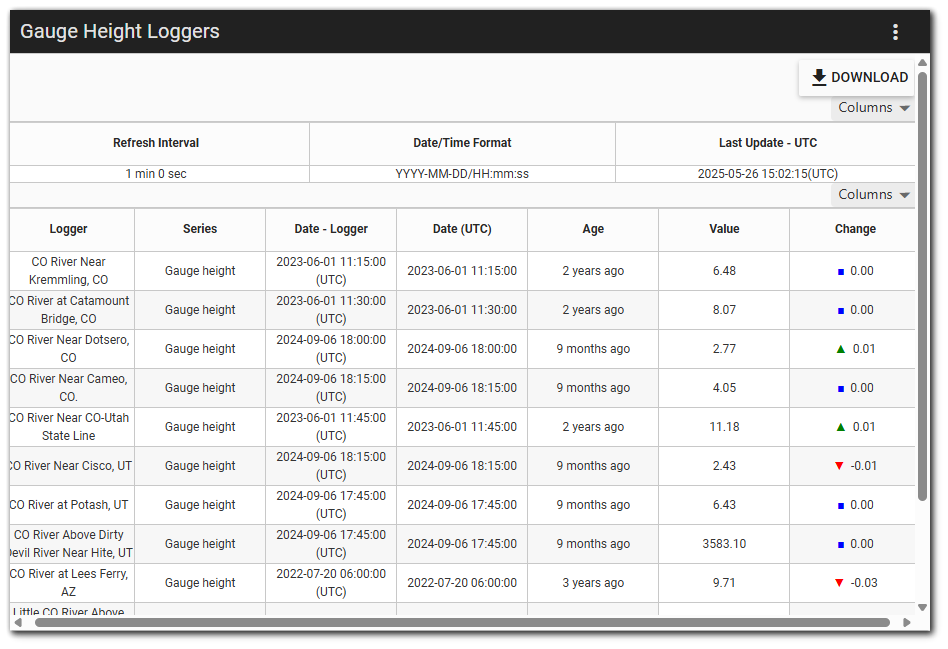
Depending on display options chosen in the Widget Editor, the table displays a number of items. The header section can indicate the auto-refresh rate (see Heartbeat in the Options section below), the date/time format used, and the date/time that the table was last updated. The body of the table can show logger, series, typical minimum and maximum values set for the series, date/time of the reading in a variety of time zones, the most recently recorded value, and the change between the most recent value and the one previous.
Columns – Select which columns to display in the header and body of the table using the drop-down list.
Download – Select the download icon to download the Live Table to a Microsoft Excel spreadsheet.
Widget Editor
To open the Widget Editor, select the More Options ![]() icon in the upper right corner of the Live Table widget to open the drop-down menu and then select the Edit menu option. The widget properties are divided into two tabs: Loggers and Options.
icon in the upper right corner of the Live Table widget to open the drop-down menu and then select the Edit menu option. The widget properties are divided into two tabs: Loggers and Options.
Widget Title – By default, the widget title is EQuIS Live - Live Table. The title can be modified.
Widget Color – The color of the widget can be changed using the Change Widget Theme![]() icon to the left of the widget title.
icon to the left of the widget title.
Help – The Help ![]() icon connects to the online documentation related to the specific widget.
icon connects to the online documentation related to the specific widget.
Copy – Select the Copy Settings ![]() icon to copy the settings from another widget of the same type. See the Copy Widget Settings article for more information.
icon to copy the settings from another widget of the same type. See the Copy Widget Settings article for more information.
Cancel – Select the Close without Saving ![]() button to exit the Widget Editor without saving changes.
button to exit the Widget Editor without saving changes.
Save – Changes will be applied to the widget by clicking on the Save ![]() button. The Widget Editor screen will close after the save operation is complete.
button. The Widget Editor screen will close after the save operation is complete.
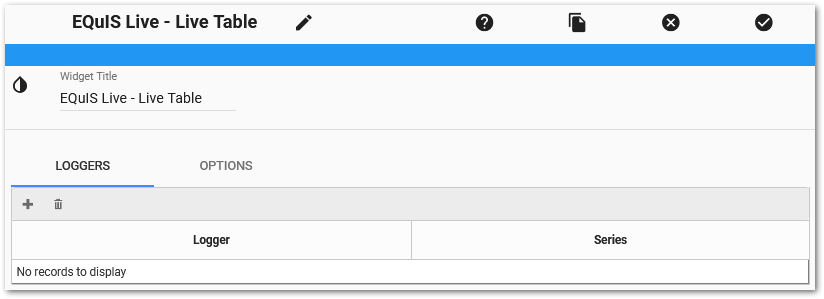
Loggers Tab
The grid at the bottom of the Loggers tab allows the user to add a new series or view the series currently displayed in the Live Table widget.
To add a logger series to the Live Table widget, click the Add ![]() icon in the upper left corner of the grid to open the Add Series window.
icon in the upper left corner of the grid to open the Add Series window.
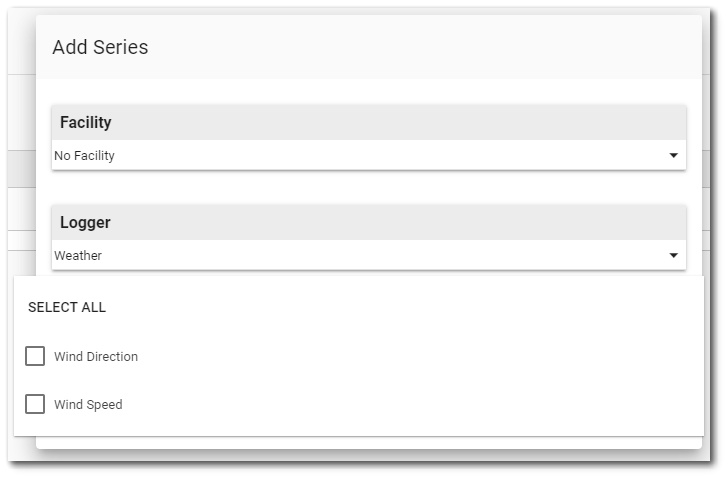
Make selections in the Loggers tab, and then click the Add button.
•Facilities – Select the facility for which the loggers should be chosen.
•Loggers – Select the logger to be tracked in the table.
•Series – Select the data series from the selected logger to place in the table.
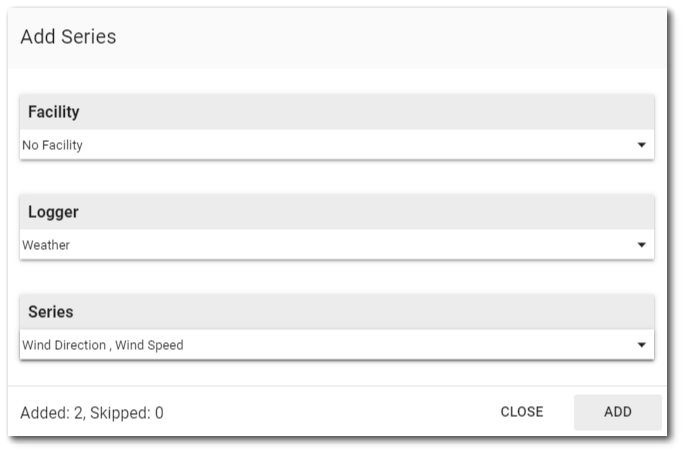
A message will convey how many series were added. Click Close when all selections are completed. The series will appear in the view grid at the bottom of the tab.
To delete a series from the widget, select the series in the view grid and click the Delete ![]() icon.
icon.
Options Tab
The following parameters for the table can be set on the Options tab:
•Table Height – Sets the height (in pixels) of the table display in the widget.
•Show Time Since Last Updated – Sets whether or not the Last Updated tab on the chart is expanded on load or not. The Last Updated tab can be expanded or closed by clicking it, although that setting will not be saved.
•Override Heartbeat and Heartbeat Seconds – If override heartbeat is checked, the update time can be set manually in heartbeat seconds. Otherwise, the transmit period seconds from DT_LOGGER will be used.
•Max Decimal Digits – The maximum number of decimal places with which data will be displayed.
•Min Color, Regular Color, Max Color, Null Value Color – Decides what color highlighting is used when the current value is below the typical minimum for the series, within limits, exceeding the typical maximum, or is a null value.
•Always Show Logger Column – If unchecked, the Logger column in the table will only display if there are series from multiple loggers added to the table.
•Show Min Max Columns – Will show the minimum and maximum values for each series, as stored in DT_LOGGER_SERIES.TYPICAL_MAX_VALUE and DT_LOGGER_SERIES.TYPICAL_MIN_VALUE, respectively.
•Show Value Age Column – Indicates how long ago the current value was recorded (e.g., 2 months ago, 3 years ago, etc.).
•Hide Series with... – When checked, will hide the series if the current value that would display on the table meets certain criteria, which includes comparisons to the series maximum and minimum values. For example, you may add a number of series to a Live Table and check Hide Series with Regular values and Hide Series with Null values. The Live Table at any given time will only show data for series where the current value is not null and falls outside of the established max/min for the series.
•Date Format – Decides whether to display the date using the local computer's regional settings (LOCAL) or to use international date format (ISO).
•Time Format – Choose the format to display time: local computer's settings, international time format, 12-hour, or 24-hour.
•Show Date/Time Format String – Adds a caption to the header of the Live table explaining which date/time formats are in use.
•Show Custom Time – Displays the value's time in the time zone corresponding to the UTC Offset entered (e.g., UTC +6).
•Show User Time – Displays the value's time in the user's system time.
•Show Logger Time – Displays the value's time in the time zone set on the logger (DT_LOGGER.UTC_OFFSET_HRS).
•Show UTC Time – Displays the value's time in UTC.