The EQuIS Live - Historical Chart widget provides visual interaction with a high volume of data over an extended period of time. Remarks and qualifiers can be displayed on the widget. Users with editor permissions to the dashboard and the widget can add, edit, and delete remarks and qualifiers.
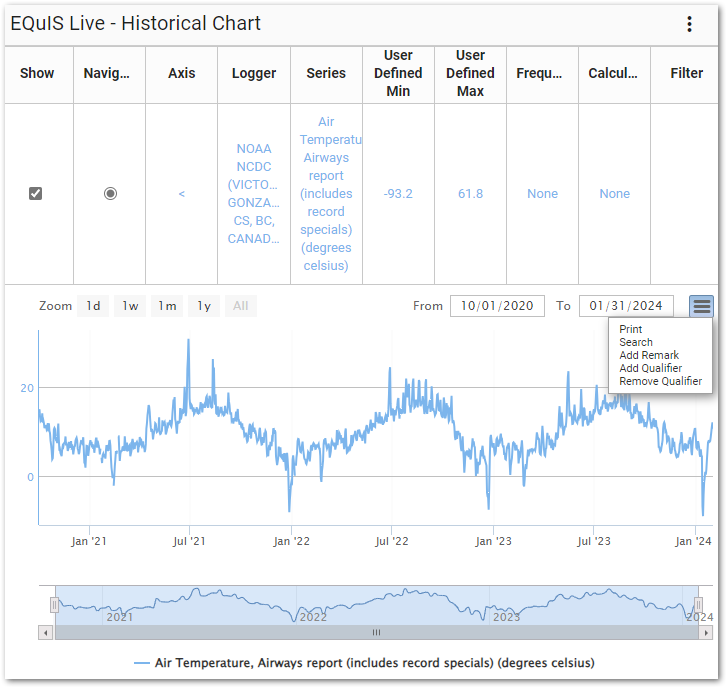
The widget contains three parts: a series table, a chart, and a legend.
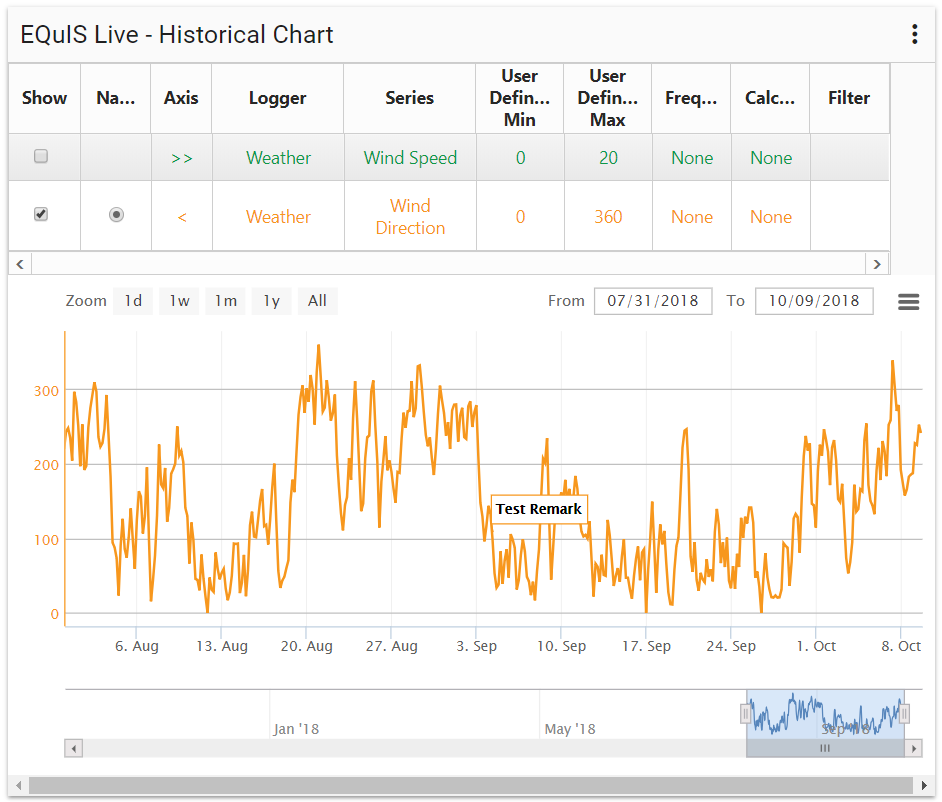
Series Table
The series table displays information about the plotted series and allows the user to show or hide the series on the chart. The name of each series and logger source are denoted. If the series has a value for DT_LOGGER_SERIES.SERIES_UNIT, the series unit is displayed in parentheses.
Toggle the Show check box for each series to show or hide that series on the chart.
The Navigator column decides which series will be shown in the Navigator at the bottom of the chart.
Click the Series name in the table to show or hide the typical range for the given series (the "plot band"). This range is defined in DT_LOGGER_SERIES.TYPICAL_MIN_VALUE and DT_LOGGER_SERIES.TYPICAL_MAX_VALUE, but can also be set manually for each series in the Widget Editor.
Note: Any series with longer description values may not get the full value displayed in the widget legend or the legend of an exported chart. |
|---|
Chart
The chart portion of the widget displays the logger data as a time series graph. The header of the chart contains a Chart Context Menu and navigation options. The user can hover over individual data points in the data series to see values. Remarks and qualifiers can be added to the chart.
Chart Navigation
The chart can be navigated by a variety of options:
•Using Zoom options (one day's worth of data, one week's etc.);
•Entering start and end dates and time;
Note: Date selectors follow the YYYY-MM-DD format to allow for consistent date structure regardless of the cultural setting configured in the web browser. |
|---|
•Using the Navigator; or
•Selecting a region of the chart to zoom in.
The Zoom buttons (top-left corner of chart) allow the user to quickly and easily zoom into a particular date range as follows:
•1d – One day
•1w – One week
•1m – One month
•1y – One year
•All – All of the data included in the widget
![]()
The dates to the right of the Zoom buttons (i.e., From and To) display the currently visible date range. For example, the series may have data from an entire year, but the user may be zoomed in to just two months. The From and To dates will display the start and end date of the time period that is currently visible on the chart.
![]()
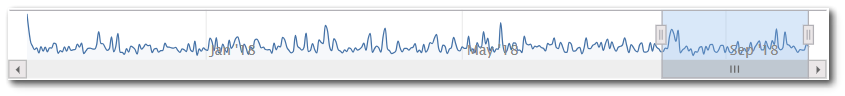
If enabled in the widget properties, the chart Navigator will appear at the bottom of the chart. The Nav column decides which series will be shown in the chart Navigator. Use the Navigator to navigate the date range that is displayed within the chart. The Navigator shows the entire date range for the chart, with the currently visible date range selected as shown in the scroll bar. Use the bottom scroll bar to scroll through the date range. Click and drag the selected range to increase or decrease the visible date range.
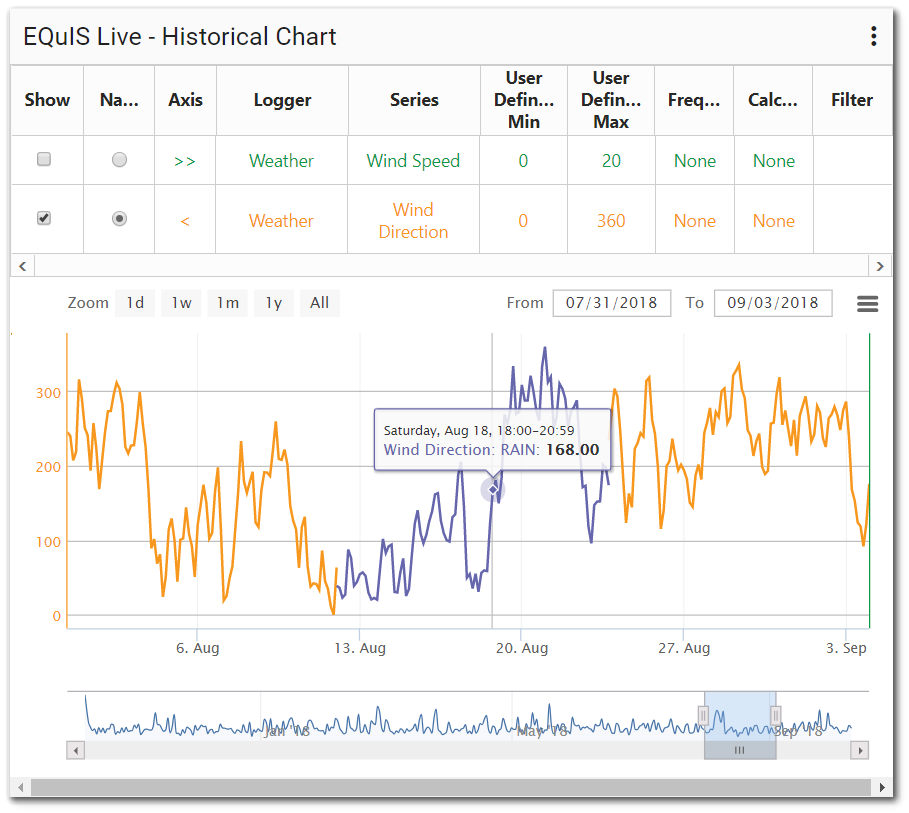
Tooltip
Hovering the mouse over the chart will display a tooltip. The top line of the tooltip contains the date/time value at the current point on the time axis (i.e., X-axis). The date/time will be displayed based on the culture specified in the current browser settings. Following the date/time value, each logger name and series will be listed (assuming the series has a value for the current date/time). The series name will be followed by the value. The values will be displayed with the number format based on the culture specified in the current browser settings.
Chart Context Menu
Options for printing chart images, searching for qualifiers and remarks, and applying remarks or qualifiers can be found from the Chart Context Menu (![]() ) in the top-right corner of the chart. The Chart Context Menu allows the user to:
) in the top-right corner of the chart. The Chart Context Menu allows the user to:
•Print – Send the visible chart to the printer or save as a PDF (Portable Document Format).
•Search – Search qualifiers and remarks between date range. Users with editor permissions can edit or delete a remark from the list that will refresh on the chart. Will only be displayed for users with appropriate permissions.
•Add Remark – Add a flag on data at a certain point to indicate an anomaly or to distinguish that data area. Will only be displayed for users with appropriate permissions.
•Add Qualifier – Highlight specific portions of data via a selected color. Will only be displayed for users with appropriate permissions.
•Remove Qualifiers – Remove qualifiers for currently visible data points. Will only be displayed for users with appropriate permissions.
Legend
The legend displays which series are configured in the series table and plotted, or available to be plotted, in the chart. Series with Show checked in the series table will be displayed in full color font and line type, while unchecked series will be shown in gray font. The values are displayed horizontally below the chart, or the Navigator, if enabled.
Note: Any series with longer description values may not get the full value displayed in the widget legend or the legend of an exported chart. |
|---|
Remarks
Remarks allows a flag to be added on the data at a certain point to indicate an anomaly or to distinguish that data area in any way desired. Users with editor permissions to the dashboard and the widget can add, edit, and delete remarks. Clicking on a remark displays a dialog that allows user to edit or delete the remark. Use the Search functionality in the Chart Context Menu to find specific remarks.
Note: A confirmation message is displayed for five seconds after adding, or editing, a remark to a series. The message displays a maximum of three lines of the remark text, including the date range of the series and series name, with remarks longer than three lines becoming truncated. |
|---|
Add a Remark
1.Edit the logger series and ensure Show Remarks is checked.
2.On the chart, zoom to a section of the series where the remark will be added. The remark will appear in the center of the selected data.
3.Click the Chart Context Menu (![]() ) in the top-right corner of the chart and select Add Remark from the drop-down menu.
) in the top-right corner of the chart and select Add Remark from the drop-down menu.
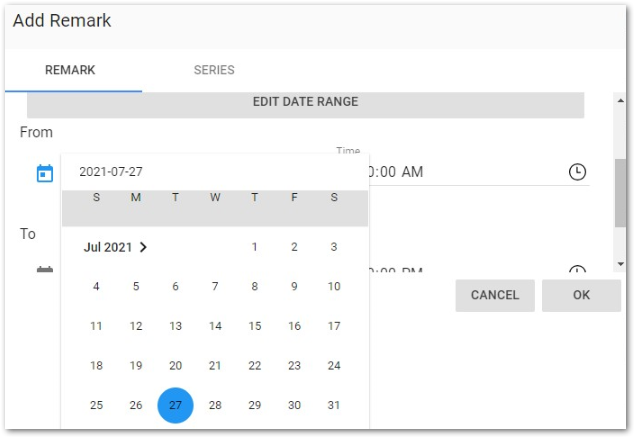
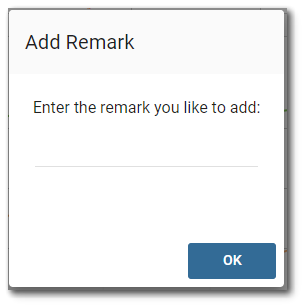
4.A dialog box will appear with two tabs (Remark and Series). On the Remark tab, type the remark.
5.To change the date range for the remark, click on the Edit Date Range button and additional fields will appear to edit the start and end date times. The date is displayed using the YYYY-MM-DD format when configuring the start and end dates for remarks.
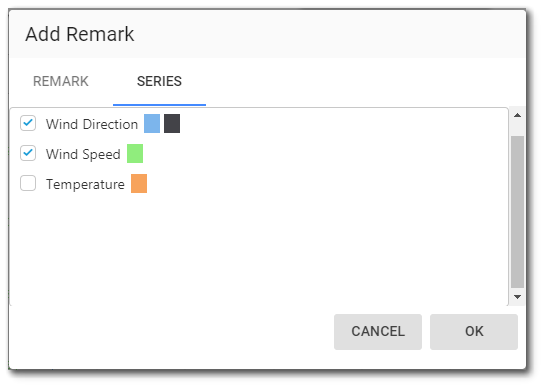
6.On the Series tab, choose which series to apply the remark. If a series is charted more than once (e.g., Daily Max and Hourly Average), they will be grouped together. A grouped series will be selected by default if one or more are displayed on the chart.
1.Click OK. The chart will reload with the remark applied.
Edit a Remark
1.Click on the text inside the remark. A dialog box will appear asking if you want to edit or delete the remark.
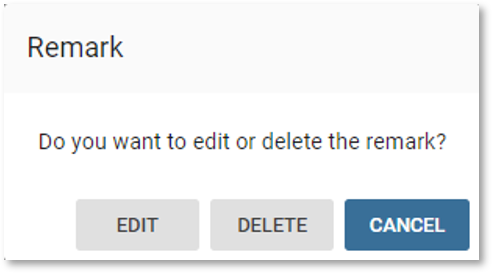
2.Click the Edit button.
3.A new dialog box will appear to edit the remark text and date range for the remark.
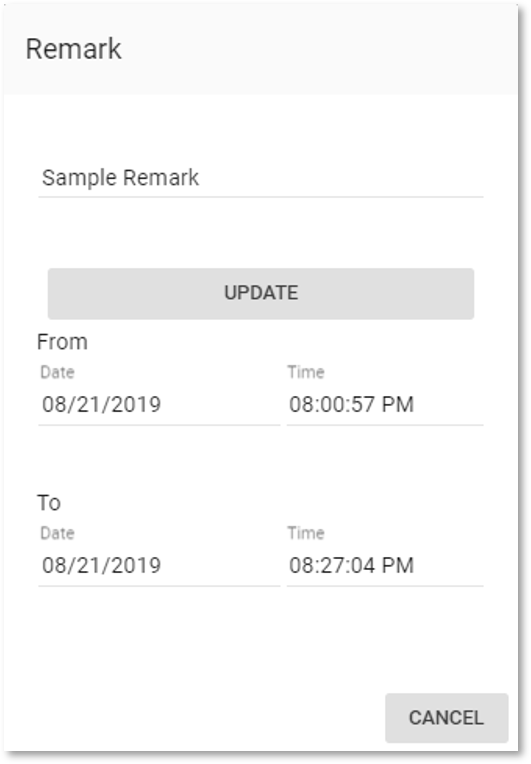
4.Click Update when done editing.
Remove a Remark
1.Click on the text inside the remark. A dialog box will appear asking if you want to edit or delete the remark.
2.Click the Delete button.
Qualifiers
Qualifiers can be used to highlight specific portions of data via a selected color. If a 'transparent' color is selected, then this can be used to hide sections of data, if desired (e.g., if a logger was found to be faulty for a certain period). Users with editor permissions to the dashboard and the widget can add, edit, and delete qualifiers.
Add a Qualifier
1.Edit the logger series and ensure the desired qualifier is added to the series.
2.On the chart, zoom to a section of the series where the qualifier will be added.
3.Click the Chart Context Menu (![]() ) in the top-right corner of the chart and select Add Qualifier from the drop-down menu. To add a qualifier to the drop-down menu or to change the color for the qualifier, go to the Qualifier tab in the Widget Editor (see section below).
) in the top-right corner of the chart and select Add Qualifier from the drop-down menu. To add a qualifier to the drop-down menu or to change the color for the qualifier, go to the Qualifier tab in the Widget Editor (see section below).
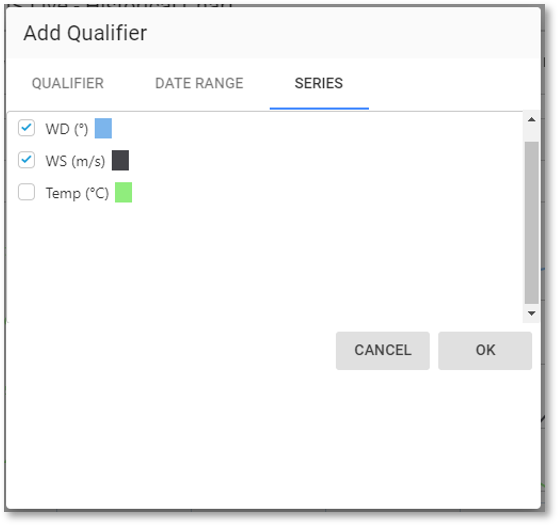
4.A dialog box will appear with three tabs (Qualifier, Date Range, and Series). On the Qualifier tab, select the qualifier to add from the drop-down menu.
5.On the Date Range tab, adjust the start and end date times for the qualifier if needed. The date is displayed using the YYYY-MM-DD format when configuring the start and end dates for qualifiers.
6.On the Series tab, choose which series to apply the qualifier. If a series is charted more than once (e.g., Daily Max and Hourly Average), they will be grouped together. A grouped series will be selected by default if one or more are displayed on the chart.
7.Click OK. The chart will reload with the qualifier applied.
Remove Qualifiers
1.Zoom to a region of data.
2.Click the Chart Context Menu (![]() ) in the top-right corner of the chart.
) in the top-right corner of the chart.
3.Select Remove Qualifiers.
Configure Remark Dialog
The Live Historical Chart widget can be configured to automatically display a remark dialogue box after a user adds, edits, or removes a qualifier from the widget.
To use this feature, the database's ST_CONFIG table must have a row with the following values:
CONFIG_SECTION |
CONFIG_KEY |
OBJECT_TYPE |
STRING_VALUE |
|---|---|---|---|
EarthSoft.Live.Widgets |
qualifier |
force_remarks |
true |
Note: If adding or removing remarks or qualifiers, it is recommended that only one data series be present on the widget, unless the series share the same time zone offset. |
|---|
Widget Properties
Use the Widget Editor to change the properties of the Live Historical Chart widget. The widget properties are divided into four tabs (Series, Options, Qualifiers, and Default Options) in the Widget Editor and are each described in the linked help article.