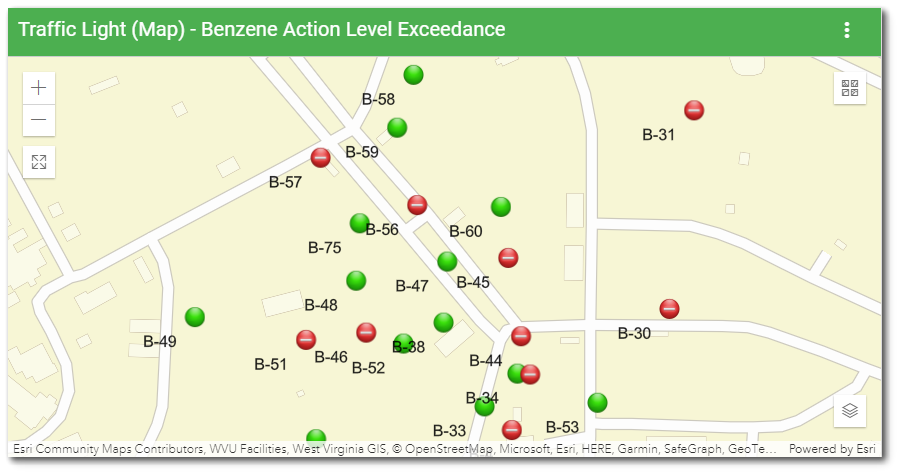
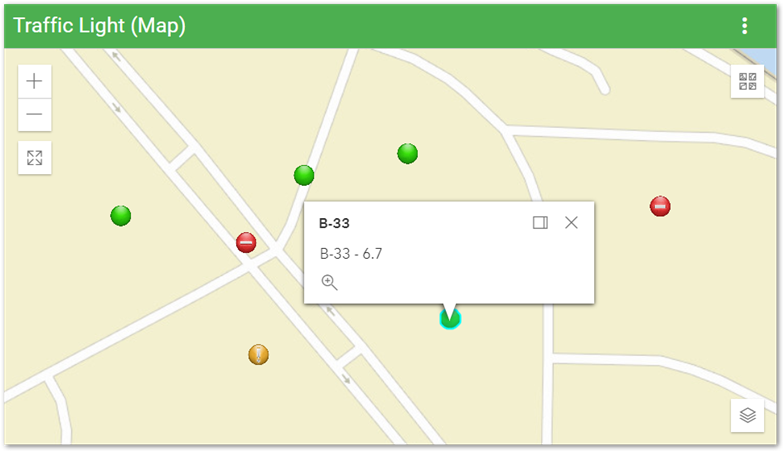
The Traffic Light Map widget displays good/bad summary data from a report, such as action levels by location, on a map. This widget shows report data as four states: Alert (![]() ), Warning (
), Warning (![]() ), OK (
), OK (![]() ), and Unknown (
), and Unknown (![]() ). The blue Unknown icon displays results that do not meet any of the set criteria. This widget is normally used for analyte exceedances, but can be used for any other type of data by configuring the conditions for each of the breaks.
). The blue Unknown icon displays results that do not meet any of the set criteria. This widget is normally used for analyte exceedances, but can be used for any other type of data by configuring the conditions for each of the breaks.
The Traffic Light Map widget uses the Esri ArcGIS Maps SDK for JavaScript by default to render report data, but can be configured to use Esri Leaflet, which loads faster and has some slight differences in features. Please review the ArcGIS Maps SDK for JavaScript licensing information and the Esri ArcGIS Maps SDK for JavaScript system requirements before using this widget.
To enable the Esri Leaflet feature, users will need to turn on the "use LeafletJS (Beta)" switch in the Widget Editor. Users can always return to the Esri ArcGIS Maps SDK for JavaScript version of the widget by toggling the "use LeafletJS (Beta)" off.
When in LeafletJS mode, the widget will have most of the same functionality in terms of mapping the report layer, but some features are not yet implemented. The report layer, symbology, sorting, and legend are still the same, but the Fullscreen and Basemap Gallery properties will not be available. Also, the widget will always zoom to the extent of the report features, regardless of how the extent is configured. Location popups (in response to clicking) are still available, but they do not have a header line that displays the SYS_LOC_CODE or the ability to step through multiple popups for the same location. Thus, the "unique features" option is always enabled in LeafletJS mode.
Unlike in Esri ArcGIS Maps SDK for JavaScript, in Esri Leaflet mode there is no default ability to render formatted dates, which means that date fields will show up as a Unix timestamp. Users who want to see dates as strings in labels and popups can use "sampledate" and "sampletime" fields, which are already formatted.
Widget Interface
The Traffic Light Map widget has the following functions in the user interface (some can be set within the User Interface tab in the widget properties):
•Zoom In and Zoom Out – Although the default view extents for the map can be set, the user can always change how much of the map is displayed. Click either the Zoom In (![]() ) or Zoom Out (
) or Zoom Out (![]() ) buttons to view the page as needed. These buttons are located on the top-left of the widget. Users can also zoom in and out by using the scroll button on the mouse.
) buttons to view the page as needed. These buttons are located on the top-left of the widget. Users can also zoom in and out by using the scroll button on the mouse.
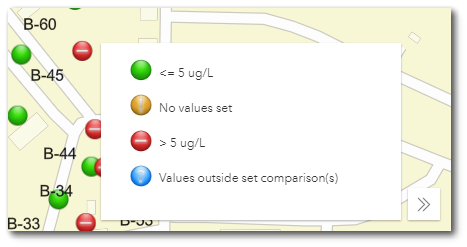
•Legend – The Expand Legend![]() button can be selected to view a drop-down list of map symbols. Click on the Collapse
button can be selected to view a drop-down list of map symbols. Click on the Collapse![]() icon to close the drop-down menu. Legend text is automatically generated for defined criteria but can be manually edited in the Widget Editor.
icon to close the drop-down menu. Legend text is automatically generated for defined criteria but can be manually edited in the Widget Editor.
•Fullscreen (Esri JS API Only) – Click the Enter Fullscreen ![]() button to expand the map to the extent of the user's screen. Selecting the button again, hitting escape on the keyboard, or hitting F11 on the keyboard will return the map to the original size of the widget.
button to expand the map to the extent of the user's screen. Selecting the button again, hitting escape on the keyboard, or hitting F11 on the keyboard will return the map to the original size of the widget.
•Basemap Gallery (Esri JS API Only) – A variety of map types are available within Enterprise. Select the Basemap Gallery ![]() button to open the drop-down selection of map types. The current options are ArcGIS defaults types. Click on the Collapse
button to open the drop-down selection of map types. The current options are ArcGIS defaults types. Click on the Collapse![]() icon to close the drop-down menu. The default basemaps are stored in the ST_CONFIG table. Acceptable entries for the default basemaps are as follows:
icon to close the drop-down menu. The default basemaps are stored in the ST_CONFIG table. Acceptable entries for the default basemaps are as follows:
Basemap Gallery Name |
ST_CONFIG Table Entry |
|---|---|
Imagery |
satellite |
Imagery with Labels |
hybrid |
Streets |
streets |
Topographic |
topo |
Dark Gray Canvas |
dark-gray |
Light Gray Canvas |
gray |
National Geographic |
national-geographic |
Terrain with Labels |
terrain |
Oceans |
oceans |
OpenStreetMap |
osm |
USA Topo Maps |
topo-vector |
USGS National Map |
streets-relief-vector |
Widget Properties
The Traffic Light Map widget is empty when added to a dashboard and must be configured to show report results. The editor for this widget allows the user to select a report, and then configure the widget appearance. To add data (select a report) or change properties of this widget, open the Widget Editor by selecting the More Options ![]() icon in the upper right corner of the widget to display the drop-down menu and then select the Edit menu option. The widget properties are divided into three tabs: General, Extents, and User Interface.
icon in the upper right corner of the widget to display the drop-down menu and then select the Edit menu option. The widget properties are divided into three tabs: General, Extents, and User Interface.
Widget Title – By default, the widget title is Traffic Light Map. The title can be modified.
Widget Description – The description field provides a caption of the widget content for screen readers. This field improves accessibility by allowing visual elements such as charts to be given accessible text descriptions. It also displays a tooltip when hovering on the widget header. Default text (of the widget type's description) is provided but can be edited by users for additional context. This field has a 250-character limit.
Widget Color – The color of the widget can be changed using the Widget Theme![]() icon to the left of the widget title.
icon to the left of the widget title.
Widget Object Editor – To set various appearance properties of the widget, select the Object Editor ![]() icon in the widget header to open the Widget Object Editor. See the Widget Editor article for more details.
icon in the widget header to open the Widget Object Editor. See the Widget Editor article for more details.
Help – The Help ![]() icon connects to the online documentation related to the specific widget.
icon connects to the online documentation related to the specific widget.
Copy Settings – Select the Copy Settings ![]() icon to to copy the settings from another widget of the same type. See the Copy Widget Settings article for more information.
icon to to copy the settings from another widget of the same type. See the Copy Widget Settings article for more information.
Cancel – Select the Close without Saving ![]() icon to exit the Widget Editor without saving changes.
icon to exit the Widget Editor without saving changes.
Save – Changes will be applied to the widget by clicking on the Save ![]() icon. The Widget Editor screen will close after the save operation is complete.
icon. The Widget Editor screen will close after the save operation is complete.
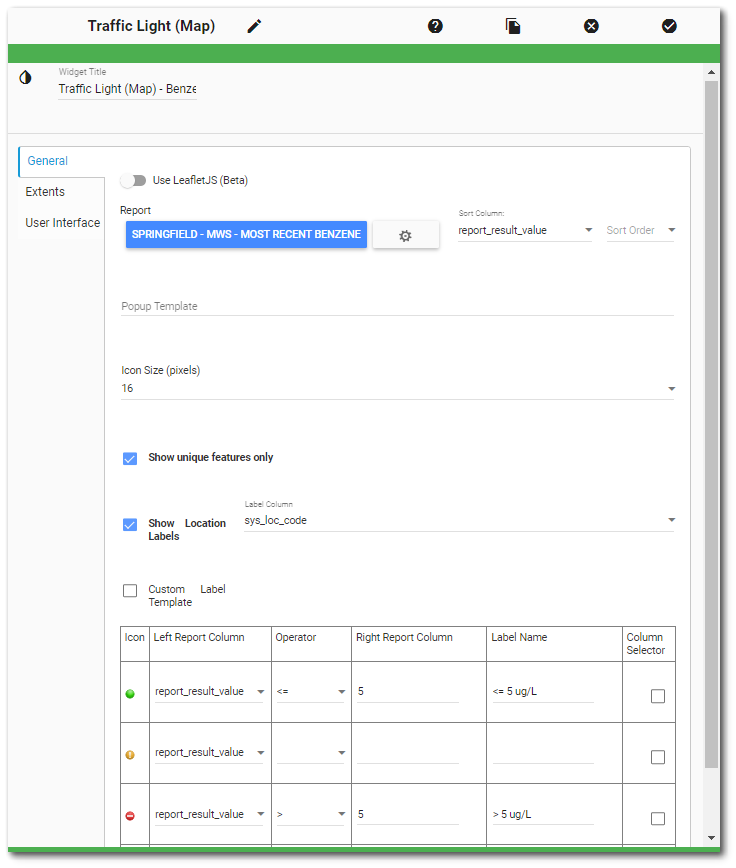
General Tab
The properties for this widget are similar to those in the Traffic Light widget.
Use LeafletJS (Beta) – By default, the widget uses the Esri JS API for mapping. To enable the LeafletJS mode, move the slider to the right. The slider will turn blue, indicating that the LeafletJS mode is enabled. When using LeafletJS mode, the Extents tab is disabled and other pertinent options change on the General and User Interface tabs. To return to the Esri JS API mode, move the slider to the left.
Report Chooser – This control is used to select the report to be used with this instance of the Traffic Light widget. The name of the currently selected report (if applicable) is displayed by default. To select a different report, click the Choose a Report button or name of the report. The Report Chooser will open and display available reports. Select the desired report.
Report Parameters – The report parameters (e.g., analyte, sample date range, etc.) can be edited by clicking on the Edit button ![]() to open the Report Parameter Editor for the selected report. A user with editor permission on the selected report may update the report.
to open the Report Parameter Editor for the selected report. A user with editor permission on the selected report may update the report.
Sort Column – Select which column will be used to sort the results. If the results are not sorted, the displayed feature will be the last result in the report output for the specific location. Many EQuIS reports, such as Analytical Results II and Action Level Exceedance II, have a default report sort order based on date in ascending order (newest results at the bottom of the report output).
Sort Order – Allows for sorting results in ascending (largest values on top) or descending (smallest value on top) order.
Popup Template – Sets the template for the popup, which is displayed when a user clicks on a traffic light icon. The template can make use of the report columns. The column name must be enclosed in { }. The dollar sign ($) is required for templates to work in LeafletJS mode. When switching between Esri JS API and LeafletJS modes, the Widget Editor will attempt to correct the differences between the popup templates by adding or removing the $ sign before the opening bracket, but it is a good idea to review the template after changing the widget mode.
Example (Esri JS API mode): {SYS_LOC_CODE}: {REPORT_RESULT_VALUE}
Example (Esri JS API mode): {SYS_LOC_CODE} - {REPORT_RESULT_VALUE} - {REPORT_RESULT_UNIT}
Example (LeafletJS mode): ${SYS_LOC_CODE}: ${REPORT_RESULT_VALUE}
Example (LeafletJS mode): ${SYS_LOC_CODE} - ${REPORT_RESULT_VALUE} - ${REPORT_RESULT_UNIT}
In Esri JS API mode, additional formatting options are available in the ArcGIS API for JavaScript. For example, the user could format a date column as follows:
{sample_date:DateFormat(datePattern:'yyyy-mm-dd',selector:'date')}
In LeafletJS mode, there is no date formatting option (date fields will be displayed as a Unix timestamp). Users who want to see dates as strings in labels and popups can use "sampledate" and "sampeltime" fields, which are already formatted.
Note: If the popup values are numeric (e.g., REPORT_RESULT_VALUE), they will not be adjusted for culture |
|---|
Icon Size (pixels) – Defines size of traffic light icons displaying in the widget.
Show Unique Features Only – When checked, results in only one feature per location are displayed. When unchecked, all the report data are displayed, with the traffic light icon for the last feature for each location on top. This feature works with the Sort Column and Sort Order properties if they are set. By default, the check box is checked. The display order of the popup content is not guaranteed when "show unique features" is unchecked. This option is always enabled in LeafletJS mode.
In the example below, the Show unique features only option is checked and only one feature is displayed per location. With the same report and the Show unique features only option unchecked, there would be 6 results for the selected location.
Show Labels – When checked, location labels are displayed. Users can select a report field from the Label Column drop-down or check the Custom Label Template option.
Custom Label Template – Allows users to configure a custom location label template.
Label Template – Sets the template for the label, which is shown next to the feature icon. The template can make use of the report columns.
In Esri JS API mode, the label template must be written in Esri Arcade script and is structured as $feature.XXX, where XXX is the report column name (e.g., $feature.sys_loc_code). If the label template is not properly formatted (e.g., does not begin with "$feature."), the symbols will not render on the widget. The custom label template can also be a concatenation of multiple columns.
Example 1: $feature.name1+' '+$feature.name2
Example 2: if($feature.report_result_value > 5100){return "Exceedance";}else if($feature.report_result_value <= 5100){return "In Compliance";}else{return "Unknown";}
In LeafletJS mode, the label template is structured as $XXX, where XXX is the report column name (e.g., $sys_loc_code).
Note: If the label values are numeric (e.g., REPORT_RESULT_VALUE), they will not be adjusted for culture |
|---|
![]()
State Symbols – For each symbol (icon) row, select a report field in the 'Left Report Column', select an 'Operator', and add a value in the 'Right Report Column'. The value can be typed in manually or can be another field in the report if the "Column Selector" box is checked (see below for greater detail). The criteria are assessed from top to bottom (green to red) with the bottom parameters taking priority. The blue symbols represent an unknown status and are displayed for any condition that does not meet the criteria set for red, yellow, or green symbols. The criteria for the blue symbol may be specified or left unset.
Label Name – Add a 'Label Name' to set the symbol label in the map legend, if desired. If the 'Label Name' is left blank and criteria are defined, the legend text will be a concatenation of the values for the 'Left Report Column', 'Operator', and 'Right Report Column'. If a symbol is not defined, the legend will be "No value set".
Column Selector – When the Column Selector box is checked, a drop-down of report fields is available in the Right Report Column and can be chosen as the value for comparison to the Left Report Column value. For example, to compare the REPORT_RESULT_VALUE to the ACTION_LEVEL_VALUE, select the REPORT_RESULT_VALUE as the Left Report Column and select the ACTION_LEVEL_VALUE as the Right Report Column.
Note: The functionality of the widget may vary depending on the data type of the selected column(s). For example, comparing a numeric value (e.g., REPORT_RESULT_VALUE) to a text value (e.g., ACTION_LEVEL) may not work—particularly in cultures that do not use a period as the decimal separator. To ensure proper operation, select columns of the same data type (e.g., REPORT_RESULT_VALUE and ACTION_LEVEL_VALUE). |
|---|
Extents Tab
This tab is enabled only for the Esri JS API option and sets the default extent for the widget. In LeafletJS mode, the extent is always based on the selected report and the Extents tab is not enabled.
Application Default – Refers to the value set in the ST_CONFIG table.
Selected Report – Refers to the calculated extent of the report used in the widget.
Custom Extent – JSON string defining an extent object. Example: { "xmin": -81.435, "ymin": 39.3, "xmax": -77.0, "ymax": 41.7, "spatialReference": { "wkid": 4326 } }.
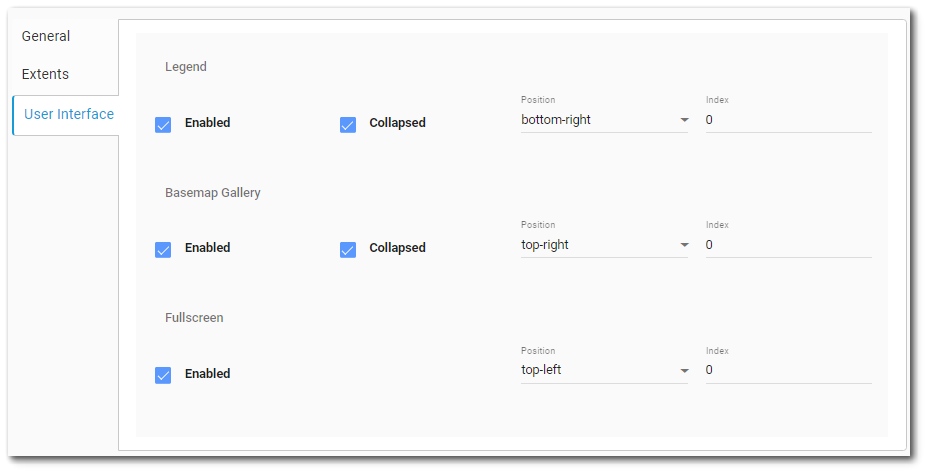
User Interface Tab
This tab lets the user customize the visibility and location for the display of the legend, basemap gallery (Esri JS API Only), and fullscreen mode (Esri JS API Only).