The Piper Diagram widget is designed to display user reports based on the EnviroInsite Piper Diagram report, which is included in the EnviroInsite Report module. For the Piper Diagram widget to be operational, the EQuIS database must contain the appropriate data and the EnviroInsite Piper Diagram report must be published to the database. The Piper Diagram widget can only display properly configured saved user reports based on the EnviroInsite Piper Diagram report. Please contact EarthSoft Support for more information about EnviroInsite.
For EQuIS Enterprise, additional files must be added to the Enterprise bin folder. The required files are packaged (EnviroInsite_Enterprise_package_x64_{#}.zip) and available on the EarthSoft Community Center Downloads dashboard (All Items\Products\EnviroInsite\v7). See the EnviroInsite Report Installation article for more detailed information.
View a training video about Piper diagrams in EnviroInsite and Enterprise here.
Description
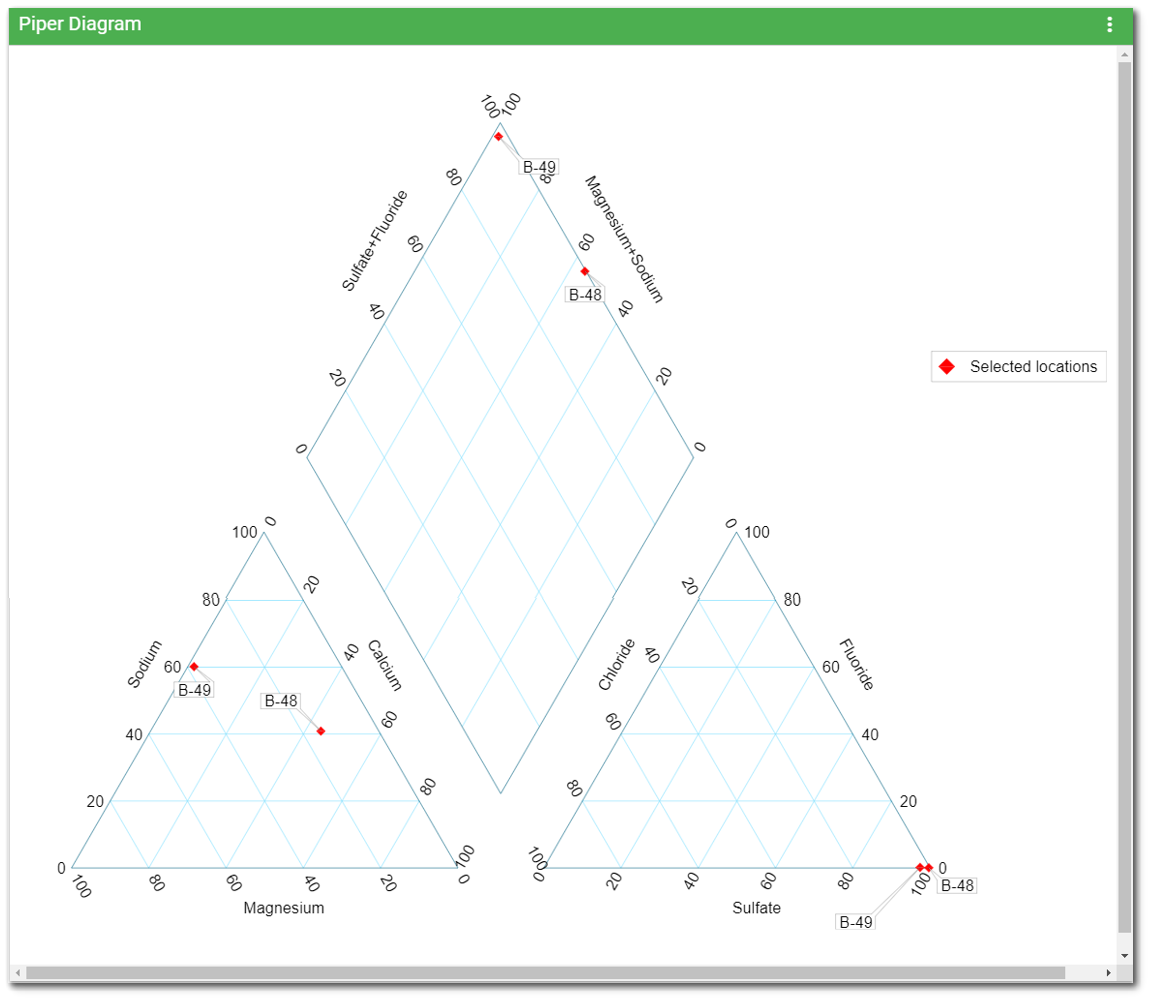
A Piper diagram is a graphical representation of the chemistry of water samples in the form of the trilinear diagram. The relative abundance of common ions (cations and anions) are shown by separate ternary plots. The Piper diagram is comprised of three components as shown in the image below:
1) The lower left ternary plot representing cations (magnesium, sodium plus potassium, and calcium);
2) The lower right ternary plot representing anions (carbonate plus bicarbonate, sulfate, and chloride); and
3) A middle diamond plot, which is a matrix transformation of the two ternary diagrams.
The plots display the relative concentrations of each sample (i.e., sum of cations = 100 and sum of anions = 100). The data points in the center diamond are located by extending the points in the lower triangles to the point of intersection in the center plot. The axis values at the top and bottom of the center diamond are 100; the axis values on the left and right side of the center plot are 0.
The Piper diagram is based on parameter concentrations expressed in equivalents per volume. The Equivalent Weight field in the constituents table is used to convert between the measured mass concentration and the concentration in equivalents or milliequivalents (meq) per liter. Equivalent weight is the mass per charge. Charge concentration is the mass concentration of an ion in water divided by the equivalent weight. The equivalent weight field should be entered as positive for cations and negative for anions.
In each sample, the three cation/anion results (in milliequivalents) are divided by the sum of the three values to produce a percent of total cations. For example, if Ca= 0.80 meq, Mg =0.26 meq, and Na+K = 0.89 meq, then %Ca = 41, %Mg = 13, and %[Na+K] = 46.
Widget Properties
The Piper Diagram widget is empty when added to a dashboard and must be configured to show report results. To select a report or change properties of this widget, open the Widget Editor by selecting the More Options ![]() icon in the upper right corner of the widget to display the drop-down menu and then select the Edit menu option.
icon in the upper right corner of the widget to display the drop-down menu and then select the Edit menu option.
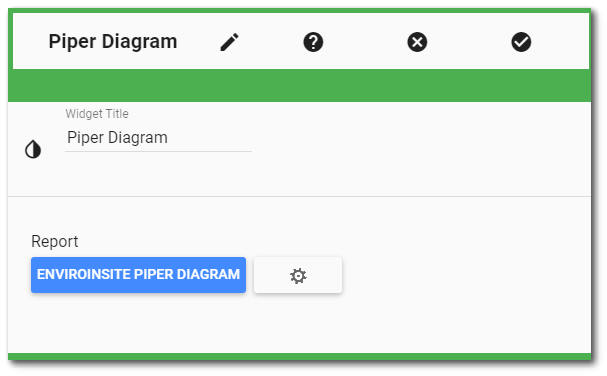
Widget Title – By default, the widget title is Piper Diagram. The title can be modified.
Widget Description – The description field provides a caption of the widget content for screen readers. This field improves accessibility by allowing visual elements such as charts to be given accessible text descriptions. It also displays a tooltip when hovering on the widget header. Default text (of the widget type's description) is provided but can be edited by users for additional context. This field has a 250-character limit.
Widget Color – The color of the widget can be changed using the Widget Theme![]() icon to the left of the widget title.
icon to the left of the widget title.
Report Chooser – This control is used to select the report to be used with this instance of the Piper Diagram widget. The name of the currently selected report (if applicable) is displayed by default. To select a different report, click the Choose a Report button or name of the report. The Report Chooser will open and display available reports. Select the desired report.
Report Parameters – The report parameters (e.g., facility, analytes, etc.) can be edited by clicking on the Edit button ![]() to open the Report Parameter Editor for the selected report. A user with editor permission on the selected report may update the report.
to open the Report Parameter Editor for the selected report. A user with editor permission on the selected report may update the report.
Notes: •The Piper Diagram report may already be created in EQuIS Professional using the EnviroInsite Piper Diagram report and published to the database. •For a report to display in the Piper Diagram Widget, the report output type must be an .svg. •In some cases, if DT_RESULT.RESULT_UNIT is null for the analytes selected in the Piper diagram, the data will not be plotted on the Piper diagram. |
|---|
Widget Object Editor – To set various appearance properties of the widget, select the Object Editor ![]() icon in the widget header to open the Widget Object Editor. See the Widget Editor article for more details.
icon in the widget header to open the Widget Object Editor. See the Widget Editor article for more details.
Help – The Help ![]() icon connects to the online documentation related to the specific widget.
icon connects to the online documentation related to the specific widget.
Copy Settings – Select the Copy Settings ![]() icon to to copy the settings from another widget of the same type. See the Copy Widget Settings article for more information.
icon to to copy the settings from another widget of the same type. See the Copy Widget Settings article for more information.
Cancel – Select the Close without Saving ![]() icon to exit the Widget Editor without saving changes.
icon to exit the Widget Editor without saving changes.
Save – Changes will be applied to the widget by clicking on the Save ![]() icon. The Widget Editor screen will close after the save operation is complete.
icon. The Widget Editor screen will close after the save operation is complete.