|
<< Click to Display Table of Contents >> Navigation: EQuIS Library > Reports > Standard Reports by Product > Standard with EnviroInsite > EnviroInsite Piper Diagram |
Report Name: EnviroInsite Piper Diagram (example)
File Name: EarthSoft.Reports.Library.EnviroInsite.dll
Dependencies: Licensed EnviroInsite Module
Software: EnviroInsite
Source: EnviroInsite install
Language: English
Output Type: *.pdf, *.svg, *.dxf, *.dwg, *.shp, *.emf, *.wmf, *.png, *.jpg, *.tif, *.vds, or *.vdml
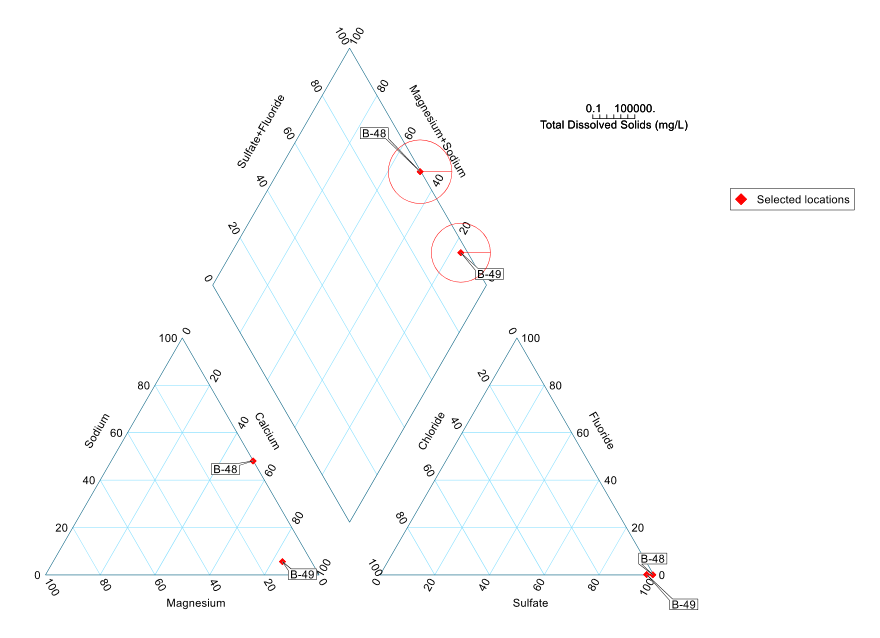
Description: The EnviroInsite Piper Diagram report produces a conventional Piper diagram for a set of user-selected anions and cations and exports the result to a vector or image graphics file.
Installation Instructions: See the EnviroInsite Report Installation article for more detailed information.
To run in EQuIS Professional, the EarthSoft.Reports.Library.EnviroInsite.dll file should be installed to the EQuIS installation folder. A local installation of EQuIS EnviroInsite v7 and a template file are required to run this export. If the reports are grayed out, make sure to select the EnviroInsite license under the Decision Support license chooser.
Note: Using versions of EnviroInsite and Professional on the same machine that are not aligned can produce an 'evaluation' version of the report output. This occurs when using: •A version of EnviroInsite >7.23.2 and a version of Professional <7.23.2 •A version of EnviroInsite <7.23.3 and a version of Professional > 7.23.2 |
For EQuIS Enterprise and ArcEQuIS, additional files must be added to the Enterprise bin folder. The required files are packaged (EnviroInsite_Enterprise_package_x64_{#}.zip) and available on the EarthSoft Community Center Downloads page (All Items\Products\EnviroInsite\v7). An EnviroInsite Decision Support license must be present as a valid entry in the ST_LICENSE table.
ArcEQuIS also requires that the report be published to the database in EQuIS Professional.
Overview:
Users may elect to plot labels indicating the sample location ID. Users may also elect to represent an additional analyte (typically total dissolved solids) as circles in the upper quadrant of the diagram, where the radius of each circle is proportional to the log-scale of the selected analyte. Label positions are auto-placed by the program to avoid overlapping of labels and crossed leader lines.
Concentrations of cations and anions are converted from mass to milliequivalents (meq) based on the entered values of equivalent weight in populated RT_ANALYTE_DETAIL.EQUIVALENT_WEIGHT fields. Only analytes for which RT_ANALYTE_DETAIL.EQUIVALENT_WEIGHT has been populated will be available for selection within the report. EnviroInsite expects that the equivalent weight of anions will be entered as negative quantities, while cations will carry positive equivalent weight values. For additional information on Piper Diagrams using EnviroInsite, please see the online help article, Piper Diagram.
Report Parameters |
||||||||||||||||||||||||||||||||||||||||||||||||||||||||||||||||||||||||||||||||||||||||||||||||
|---|---|---|---|---|---|---|---|---|---|---|---|---|---|---|---|---|---|---|---|---|---|---|---|---|---|---|---|---|---|---|---|---|---|---|---|---|---|---|---|---|---|---|---|---|---|---|---|---|---|---|---|---|---|---|---|---|---|---|---|---|---|---|---|---|---|---|---|---|---|---|---|---|---|---|---|---|---|---|---|---|---|---|---|---|---|---|---|---|---|---|---|---|---|---|---|---|
|
Notes: •Our developers are working on adding a helpful message when data is missing from the dataset, rather than producing an empty output. However, to avoid receiving a blank Piper Diagram in the output, be sure the following data requirements exist: oAt least six analytes (three cations and three anions) that contain data from the same sample are chosen. It is often helpful to first run the Analytical Results II Report for the selected analytes to check. oDT_RESULT.RESULT_UNIT cannot be null for any of the selected analytes. oDT_TEST.FRACTION should match across the selected analytes, and this FRACTION should be selected as a parameter. •If the same ion has Total (T), Dissolved (D), and Not applicable (N) Fractions within a location, the output (D) or (T) or (N) will be displayed in the order of priority.
Warning: The selections in the EnviroInsite query do not get reset after running the report. For example, if Bicarbonate is selected in the parameters and the report returns a blank output because Bicarbonate does not have data, and then Bicarbonate is removed from the report parameter selection and rerun, the report output will still be blank. The workaround for this issue is to clear the workspace before rerunning the report/form. This has been escalated for resolution in a future build. |
Copyright © 2026 EarthSoft, Inc. • Modified: 06 Oct 2025