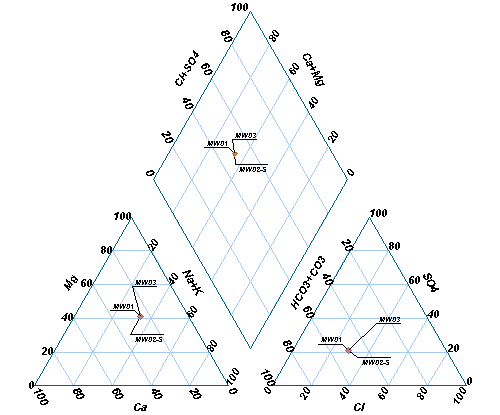
A Piper diagram is a graphical representation of the chemistry of water samples in the form of the trilinear diagram. The relative abundance of common ions (cations and anions) are shown by separate ternary plots. The Piper diagram is comprised of three components as shown in the image below:
1.The lower-left ternary plot representing cations (magnesium, sodium plus potassium, and calcium);
2.The lower-right ternary plot representing anions (carbonate plus bicarbonate, sulfate, and chloride); and
3.A middle diamond plot, which is a matrix transformation of the two ternary diagrams.
The plots display the relative concentrations of each sample (i.e. sum of cations = 100 and sum of anions = 100). The data points in the center diamond are located by extending the points in the lower triangles to the point of intersection in the center plot. The axis values at the top and bottom of the center diamond are 100; the axis values on the left and right side of the center plot are 0.
The Piper diagram is based on parameter concentrations expressed in equivalents per volume. Equivalent weight values are required to be populated in the database prior to plotting this data. For more information, see the Equivalent Weight page.
In each sample, the three cation/anion results (in milliequivalents) are divided by the sum of the three values to produce a percent of total cations. For example, if Ca= 0.80 meq, Mg = 0.26 meq, and Na+K = 0.89 meq, then %Ca = 41, %Mg = 13, and %[Na+K] = 46.
Create Piper Diagram
View a training video on creating Piper diagrams in EnviroInsite here.
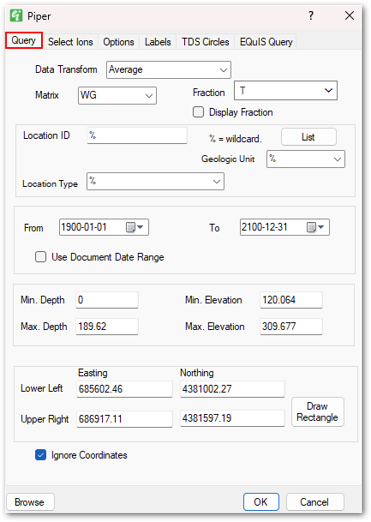
Open the Tasks Pane on the right-hand side of the EnviroInsite interface, select Create Window and then select Piper Diagram. Piper diagrams can also be created by selecting Window> New> Piper Diagram from a plan view map. A new view window is generated and the Piper Diagram dialog box opens. Modify the diagram properties on the Query tab, Select Ions tab, Options tab, Labels tab, TDS Circles tab, and EQuIS Query tab as desired. See Piper Diagram Tabs for more information. The most commonly selected anions are (1) Cl, (2) HCO3 + CO3 and (3) SO4 and selected cations are (1) Na + K, (2) Ca and (3) Mg. Click the OK button to save changes.
One of the unique features of Piper diagrams generated in EnviroInsite is the ability to post the well and screen label. Individual well labels may be turned on or off by deselecting the check box associated with each label from the tree control menu.
For EQuIS EnviroInsite clients, if the diagrams are not displaying as expected, check to see if DT_FACILITY.ELEV_UNIT is populated. If it is not, consider populating this information. Although it is not a required field for this report, it is recommended.
Notes: •Our developers are working on adding a helpful message when data is missing from the dataset, rather than producing an empty output. However, to avoid receiving a blank Piper Diagram in the output, be sure the following data requirements exist: oAt least six analytes (three cations and three anions) that contain data from the same sample are chosen. It is often helpful to first run the Analytical Results II Report for the selected analytes to check. oDT_RESULT.RESULT_UNIT cannot be null for any of the selected analytes. oDT_TEST.FRACTION should match across the selected analytes, and this FRACTION should be selected as a parameter.
Warning: The selections in the EnviroInsite query do not get reset after running the report. For example, if Bicarbonate is selected in the parameters and the report returns a blank output because Bicarbonate does not have data, and then Bicarbonate is removed from the report parameter selection and rerun, the report output will still be blank. The workaround for this issue is to clear the workspace before rerunning the report/form. This has been escalated for resolution in a future build. |
Query Tab: Allows the data to be plotted in the piper diagram to be filtered. Various options are available to filter the data including location, date, depth, and coordinates.
The Fraction drop-down menu allows users to select multiple fractions for a target compound. The generated Piper Diagram will plot locations when each chemical in a compound is associated with either of the selected fractions consistently across locations. For example, a user selects fractions D and T, where Calcium and Magnesium are D, and Sodium is T across all locations.
Note: An error will be displayed when a user selects multiple fractions and there are different locations that contain results for the same compound, but with different fractions. The error message is: "The plot cannot be generated because of different fractions detected for the same compound.". |
The Display Fraction check box allows users to specify if the individual chemical fraction should be displayed near the chemical name in the output diagram. If the same ion has Total (T), Dissolved (D), and Not applicable (N) Fractions within a location, the output (D) or (T) or (N) will be displayed in the order of priority.
Select Ions Tab: Allows users to select the anions and cations that will be plotted. Each line on the piper diagram can represent a single ion or the sum of two ions. Leave the second ion blank to plot a single ion or leave both ions blank to not plot a particular line.
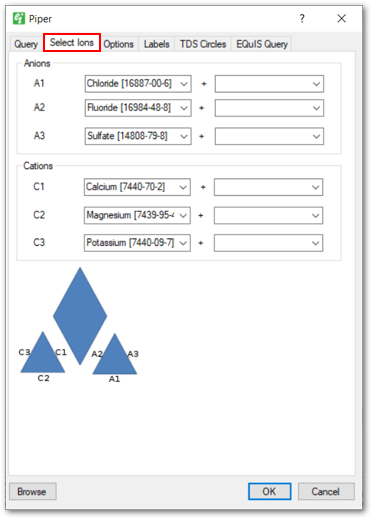
Note: An error will occur if chemicals are selected more than once as an Anion or Cation. |
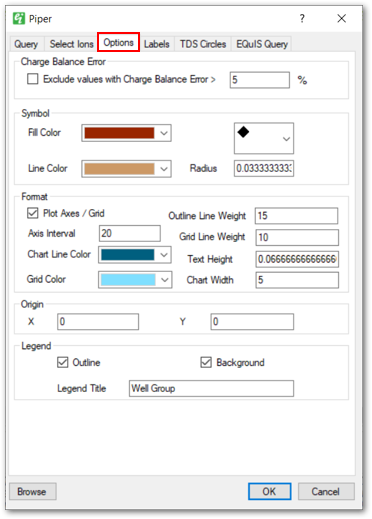
Options Tab: Enables users to specify how a piper diagram will appear when plotted, such as configuring the fill color, symbol shapes, line weight, text height, chart width, etc.
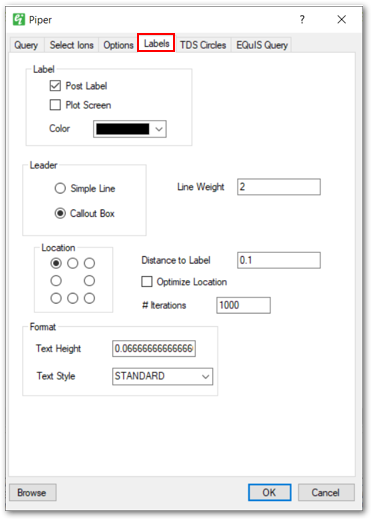
Labels Tab: Provides options for specifying which labels should be plotted and how those labels should appear. Users can specify the label distance, position, text height, text style, and leader line style.
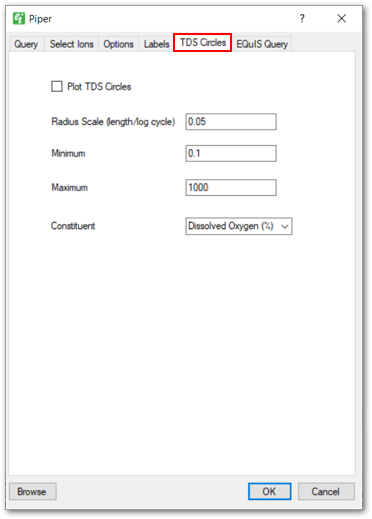
TDS Circles Tab: Allows users to enable plotting circles for indicating TDS concentrations. The circles are plotted in the upper portion of the piper diagram.
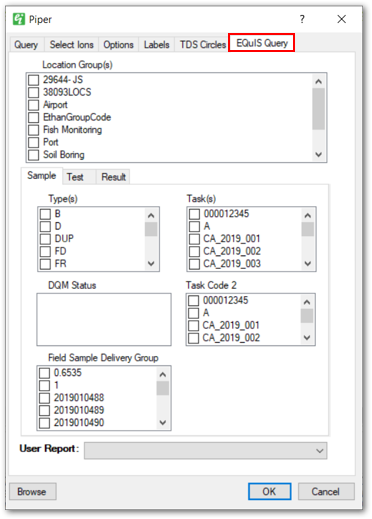
EQuIS Query Tab: Allows users to select additional EQuIS data. Additional information about this tab is available in the EQuIS Query Tab article.
Change Default Units
If analytes used within a Piper Diagram were reported in different units, the default units used can be changed as follows, with results being converted accordingly:
1.Go to the Default Units tab within Edit > EQuIS Options and type in the new units.
2.Right-click on the Piper Diagram layer name in Plot Control and click Edit or double-click on the Piper Diagram to open the Piper dialog window.
3.Click OK or Apply to redraw the data. The Browse button will show you the new data once your parameters have been selected. Labels will stay in their original position unless "Optimize Locations" is checked or the label positioning is changed on the Labels tab.