Stiff diagrams are graphical presentations of the cation and anion content of water presented in milliequivalents per liter. More information on the application of Stiff diagrams can be found in the USGS Water Supply Paper 2254, Study and Interpretation of the Chemical Characteristics of Water available at http://pubs.usgs.gov/wsp/wsp2254/.

By convention, cations are plotted on the left side of the Stiff diagram and anions on the right. Equivalent weight values are required to be populated in the database prior to plotting this data. For more information, see the Equivalent Weight page.
Stiff diagrams may be generated as either georeferenced plots (small diagrams with a leader to the well location) or as full page Stiff diagrams. In the full page Stiff diagram plot, the diagrams are lined up vertically along the centerline of the page. To create a full page Stiff diagram:
1.Select Window> New> Stiff Diagrams from a plan view, or, on the Tasks Pane, select Create Window and then select Stiff Diagram. A new view window is generated and the Stiff Diagram dialog box opens.
2.Modify the properties of the Stiff diagram plot on the Query tab, Select Ions tab, Options tab, Labels tab, EQuIS Query tab and Delta tab as desired.
3.Click the OK button to save changes.
For EQuIS EnviroInsite clients, if the diagrams are not displaying as expected, check to see if DT_FACILITY.ELEV_UNIT is populated. If it is not, consider populating this information. Although it is not a required field for this report, it is recommended.
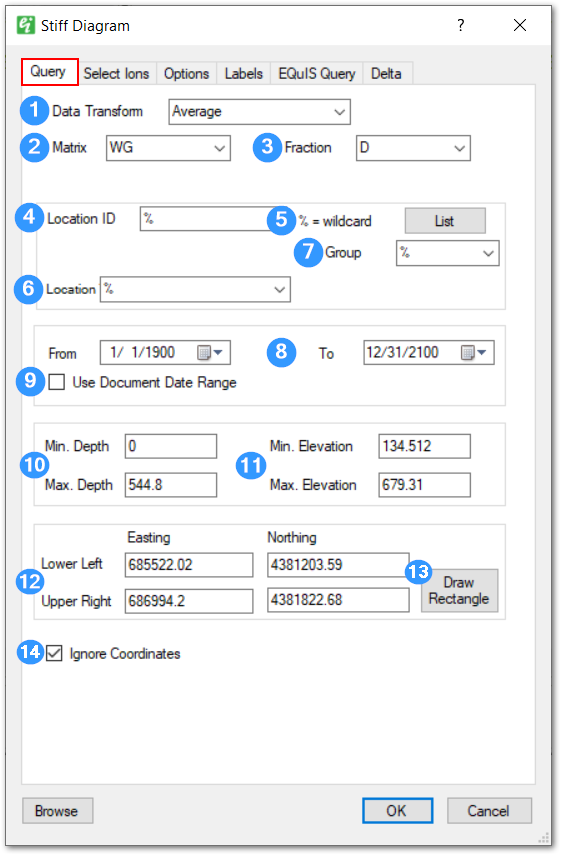
Query Tab
|
|
1 - Select from Average, Min, Max, First, and Last to specify how to handle multiple values at a single location. |
|
2 - Select the sample media. |
|
3 - Select the measurement fraction (typically either total or dissolved). |
|
4 - Set the Location ID to plot, where "%" is a wild card. |
|
5 - Click the List button to select particular measurement locations. |
|
6 - Select the Location.Class value to filter measured data. |
|
7 - Select the Interval Group. |
|
8 - Select the start and end date to query data. |
|
9 - Check the check box to use the date ranges in the document time line. |
|
10 - Select the minimum and maximum depth values to query measured data. |
|
11 - Select the minimum and maximum elevation values to query measured data. |
|
12 - Edit the limits of the selection range. |
|
13 - Click the Draw Rectangle button to define the selection rectangle. |
|
14 - Check the check box to draw a Stiff Diagram irrespective of the value of coordinates. This option allows Stiff Diagrams to be generated even with no specified coordinates. |
|
Select Ions Tab
The anions and cations to be plotted in the Stiff diagram are selected on the Select Ions tab of the Stiff Diagram dialog box. Each line on the Stiff diagram can represent a single ion or the sum of two ions. Leave the second ion blank to plot a single ion or leave both ions blank to not plot a particular line.
|
|
1 - Select anions to appear in the Stiff Diagram. The equivalent weight values for these analytes must be set to a negative value in order to appear in the drop-down lists. Select the blank value to not include a particular row. The second column enables the concentrations (post-normalization) of two analytes to be summed. |
|
2 - Select the cations to appear in the Stiff Diagram. The equivalent weight values for these analytes must be set to a positive value in order to appear in the drop-down lists. Select the blank value to not include a particular row. |
|
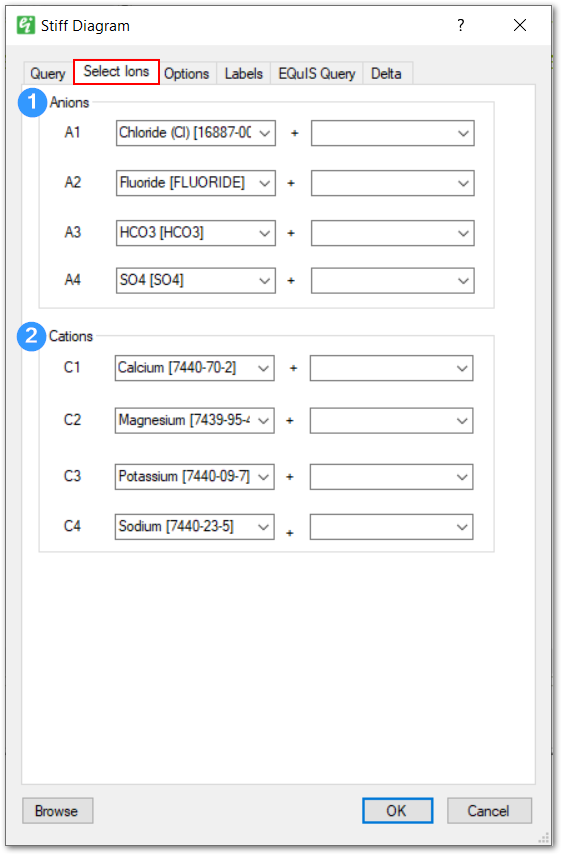
Note: An error will occur if chemicals are selected more than once as an Anion or Cation. |
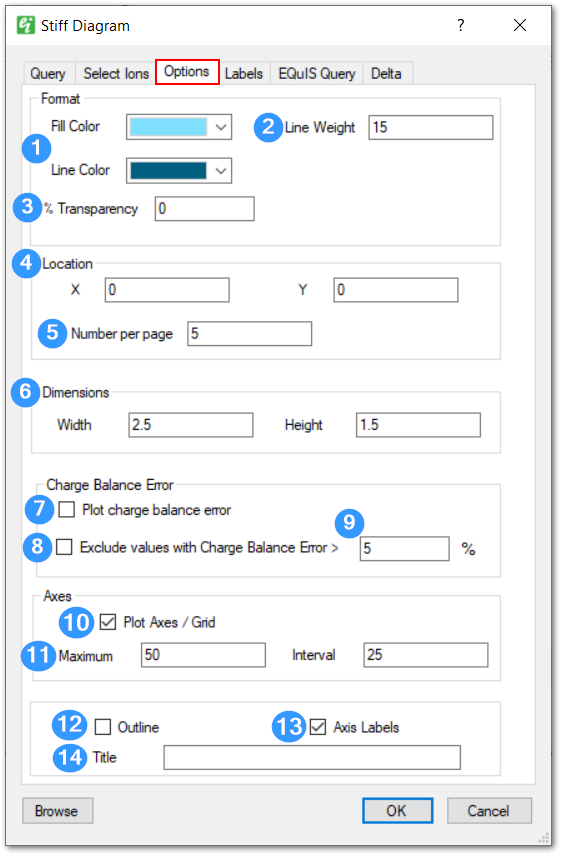
Options Tab
|
|
1 - Select the Stiff Diagram fill and outline colors. |
|
2 - Set the line weight in 100ths of a millimeter. |
|
3 - Set the percent transparency. |
|
4 - Set the Stiff Diagram page location. |
|
5 - Number of Stiff Diagrams per page. |
|
6 - Set the Stiff Diagram dimensions in map view coordinates. |
|
7 - Check the check box to calculate and plot the charge balance error percentage. |
|
8 - Check the check box to not plot Stiff Diagrams with charge balance errors greater than the specified value. |
|
9 - Set the Stiff Diagram charge balance error criteria used in event the Exclude Values option is checked. |
|
10 - Check the check box to plot axes and grid for each Stiff Diagram. |
|
11 - Set the axis maximum value and tick interval. |
|
12 - Check the check box to draw a legend outline. |
|
13 - Check the check box to plot a legend background. |
|
14 - Enter the legend title. |
|
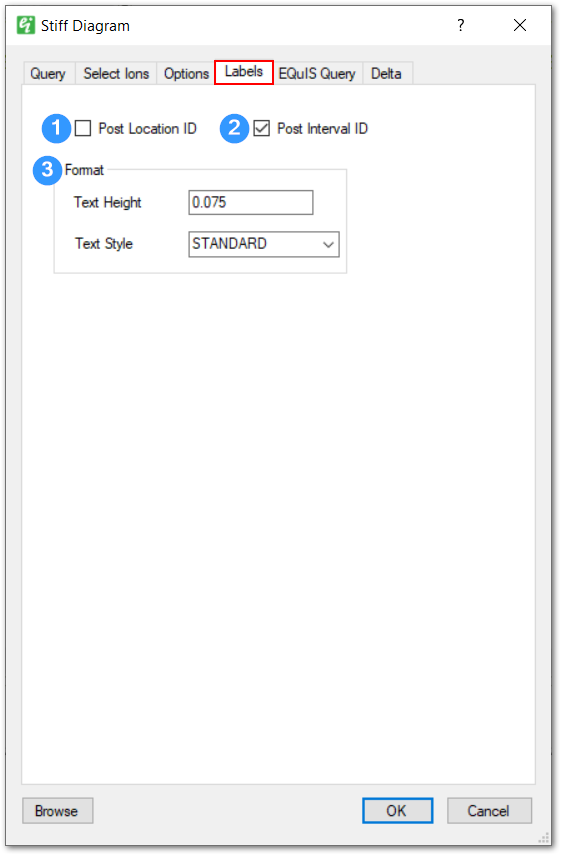
Labels Tab
|
|
1 - Check the check box to post the Location ID. |
|
2 - Check the check box to post the Interval ID. |
|
3 - Set the text height (in page view coordinates) and text style. |
|
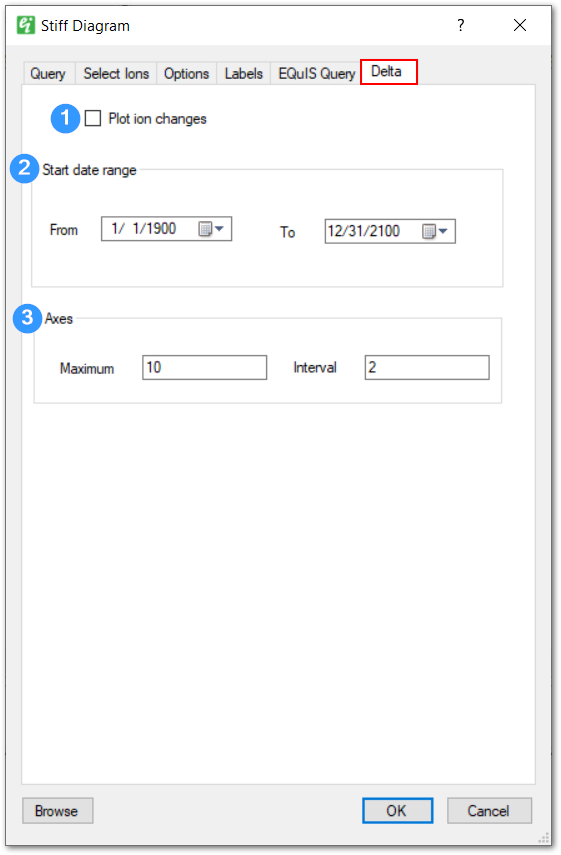
Delta Tab
|
|
1 - Check the check box to plot differences between two sets of Stiff Diagrams. |
|
2 - Select the date range of measurements against which the base Stiff Diagram will be measured. |
|
3 - Set the maximum value and tick mark interval for the delta diagram plot. |
|