Stiff diagrams are graphical presentations of the cation and anion content of water presented in milliequivalents per liter. More information on Stiff diagrams is available here.
By convention, cations are plotted on the left side of the Stiff diagram and anions on the right. Equivalent weight values are required to be populated in the database prior to plotting this data. For more information, see the Equivalent Weight help page.
Stiff diagrams may be generated as either georeferenced plots (small diagrams with a leader to the well location) or as full page Stiff diagrams. In the full page Stiff diagram plot, the diagrams are lined up vertically along the centerline of the page. To create georeferenced Stiff diagrams:
1.Select Plot> 2D data> Stiff Diagrams.
2.Modify the properties of the Stiff diagram plot on the Query tab, Select Ions tab, Options tab, Labels tab, and EQuIS Query tab as desired.
3.Click the OK button to save changes.
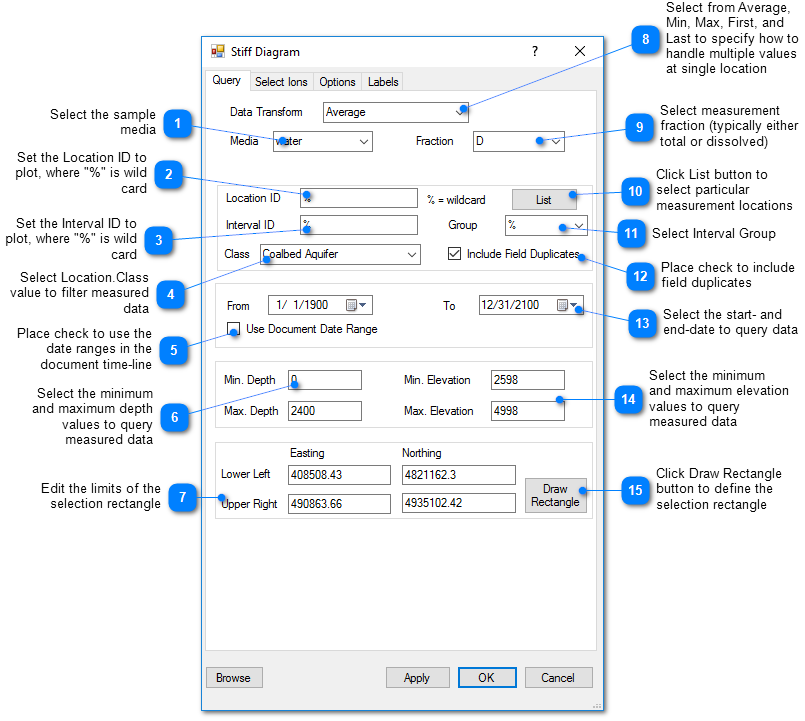
Query Tab
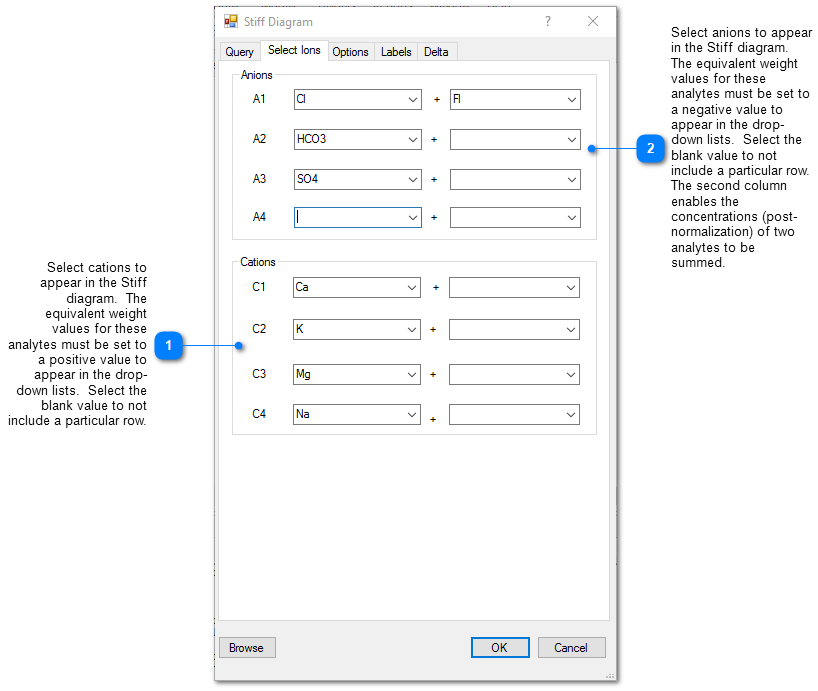
Select Ions Tab
The anions and cations to be plotted in the Stiff diagram are selected on the Select Ions tab of the Stiff Diagram dialog box. Each line on the Stiff diagram can represent a single ion or the sum of two ions. Leave the second ion blank to plot a single ion or leave both ions blank to not plot a particular line.
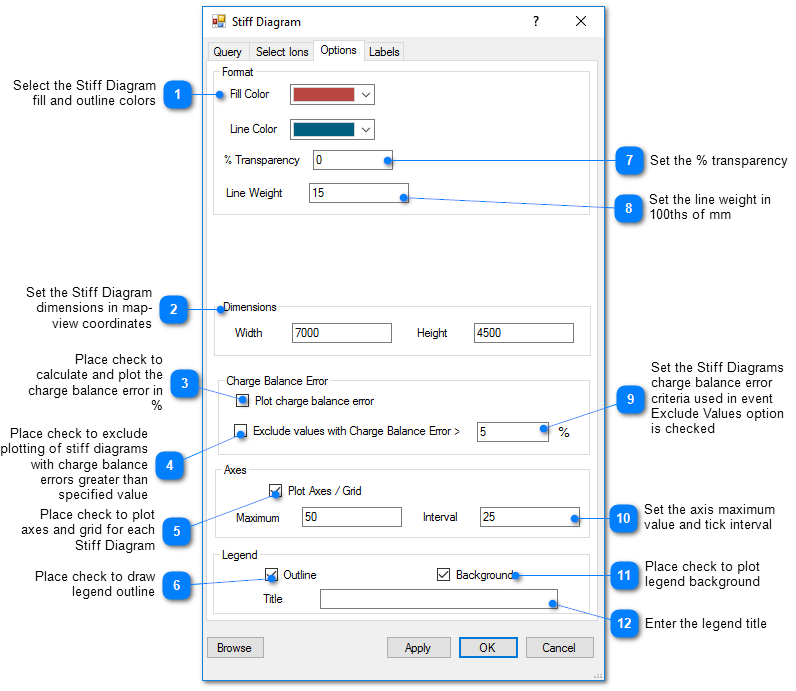
Options Tab
In addition to the query options, the Stiff diagram dialog box offers the following options to customize the appearance of the plot.
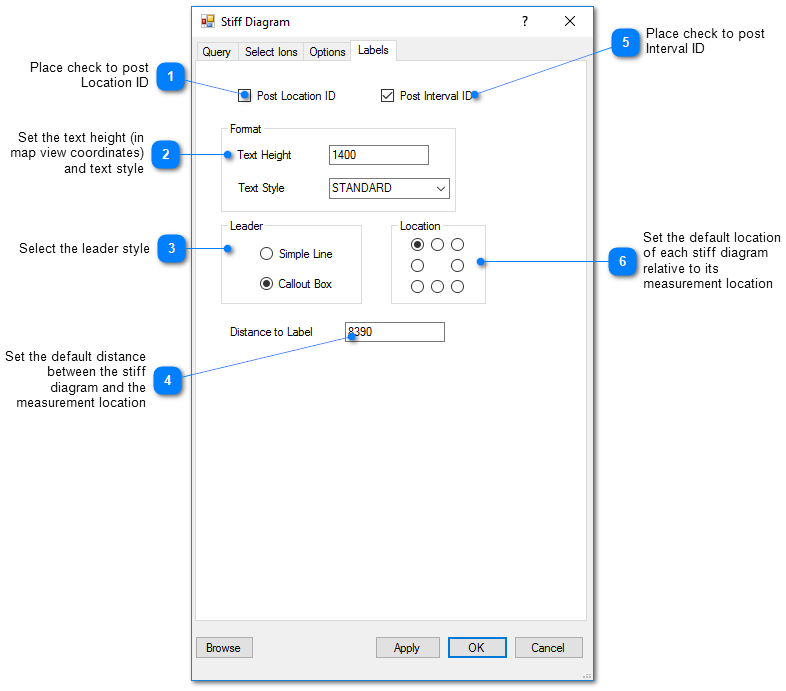
Labels Tab