A radial diagram is a graph where values extend out from a central point, and therefore, demonstrate relationships of constituents. Radial diagrams are useful in assessing the natural attenuation of decaying contaminants, as they provide readily identifiable visual representations of the spatial patterns of contaminants and daughter products and the availability of electron acceptors and other metabolites. Radial diagrams can be drawn in both plan and profile maps to understand the horizontal and vertical spatial patterns.
Click Plot> 2D Data from the main menu and select Radial Diagram. Select the desired constituents and modify the properties of the radial diagram plot on the Query tab, Axes tab, Options tab, and EQuIS Query tab as desired in the Radial Diagram dialog box. Click the OK button to save changes.
Query Tab
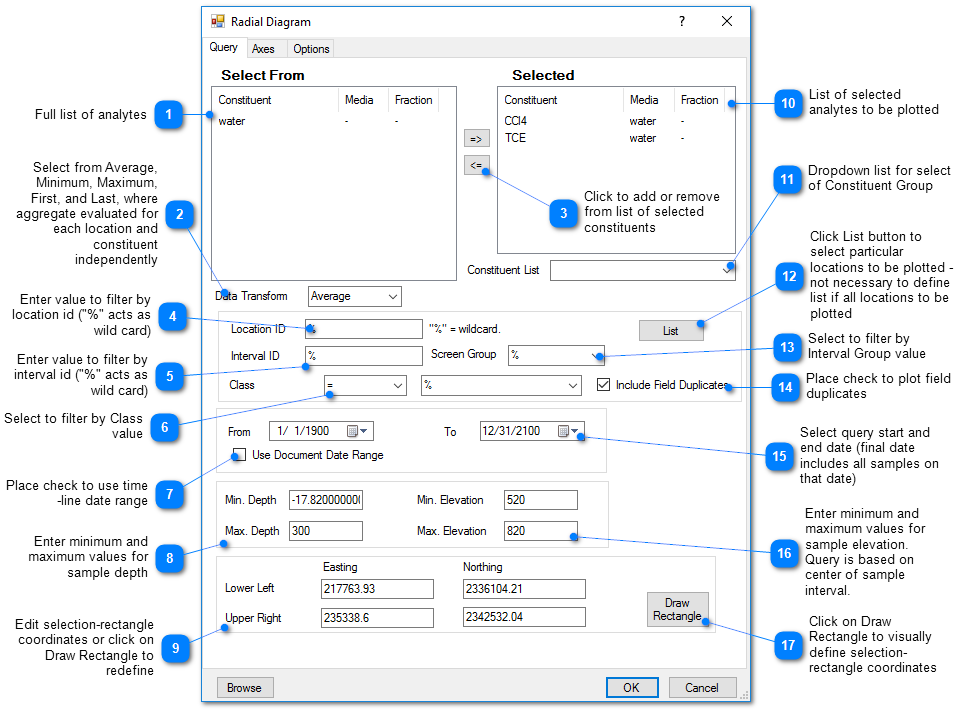
To add a constituent, select it in the left control window and click the button with the right arrow (=>) to move it to the list of selected constituents. To remove a constituent from the list of selected constituents, simply select the row and click the button with the left-arrow (<=).
Axes Tab
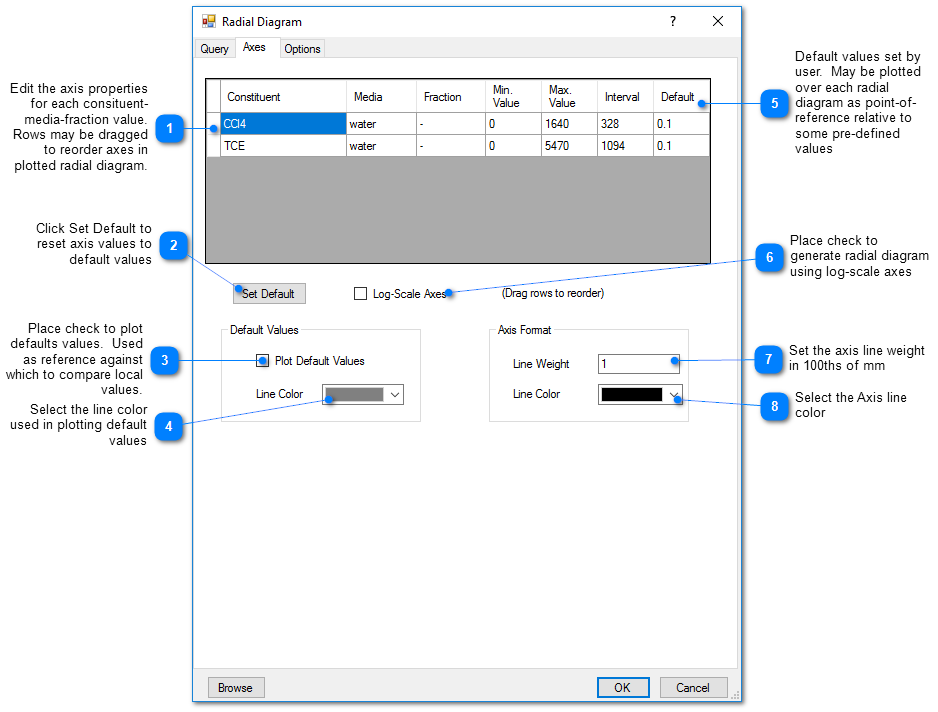
The constituent order in the radial diagram is determined by the order in the constituent grid control. The order can be shifted by selecting the header column and dragging the row to the position you want.
Note: When setting axis values, the radial diagrams will not plot if the Minimum value and Maximum value are the same. |
Options Tab
% Transparency – Percent transparency of individual radial diagrams.
Radius – Specify radius of radial diagrams in world coordinates.
Fill Color – Select color for filling the interior of the radial diagram.
Line Color – Select color for the outline of the radial diagram.
Text Style – Select text style.
Plot with Missing Values – Select to plot radial diagrams even if there is no measured value for one of the constituents.
Chart Location – Location of radial diagram relative to well location.
Distance to Chart – Set the default distance from the well to the diagram. The radial diagrams may be aligned at the well locations by setting this value to 0.0. The radial diagram(s) can also be relocated to a new position by selecting and dragging a diagram with the mouse.
Legend Background – Check to plot a white legend background.
Legend Outline – Check to plot legend box outline.
Show distance to profile – Check to print the capture distance in the legend (on x-section plots only).