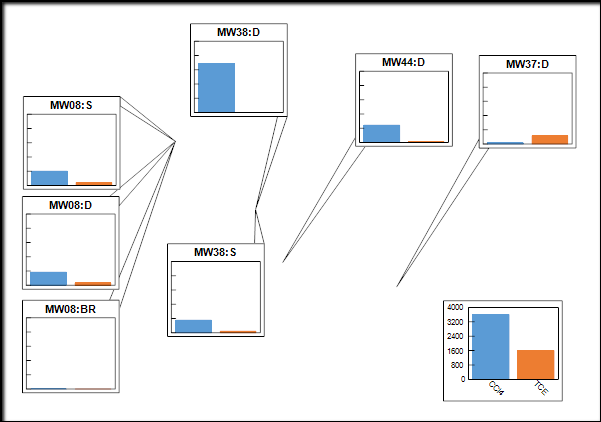
A bar chart is a graph that depicts data with rectangular bars where the length of the bar is proportional to the value. Georeferenced bar charts can be used to display the relative proportion of multiple constituents.
Click Plot> 2D Data from the main menu and select Bar Chart. The Bar Chart dialog box opens. Modify the properties of the bar chart plot on the Query tab, Format tab, Options tab, and EQuIS Query tab as desired. Click the OK button to save changes.
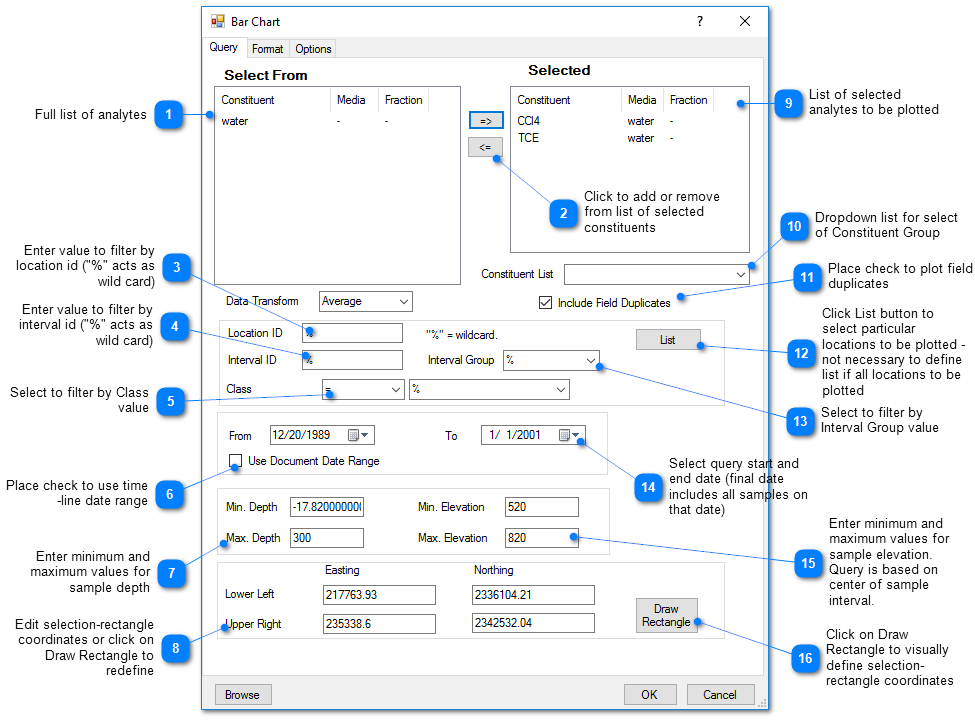
Query Tab
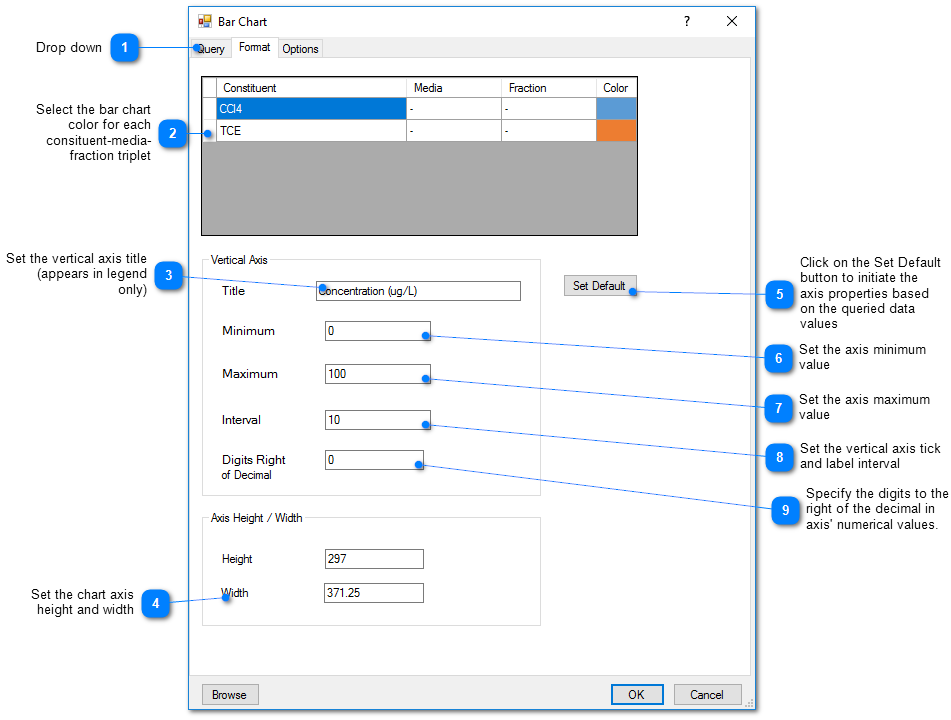
Format Tab
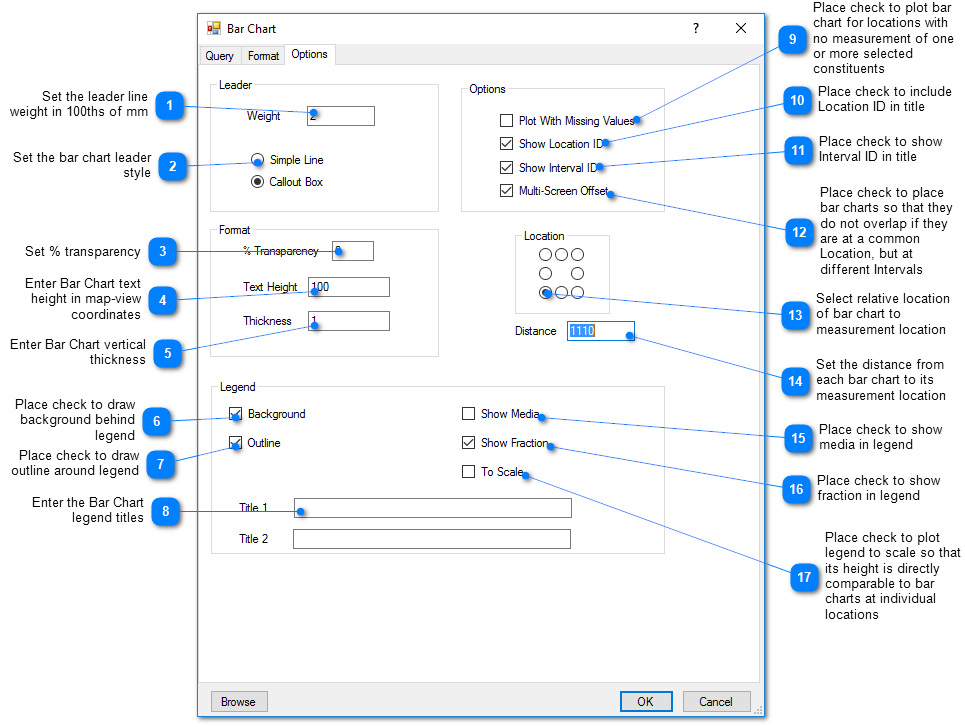
Options Tab