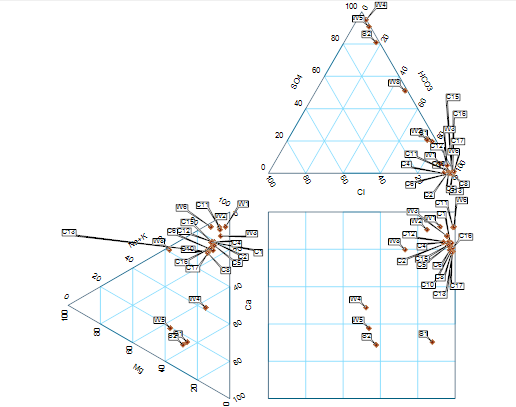
Durov plots demonstrate the relationship between various ions for hydrochemical samples and are an alternative to Piper diagrams. Durov plots are based on milliequivalent percentages of the total major cations and anions in the water sample. Equivalent weight values are required to be populated in the database prior to plotting this data. For more information, see the Equivalent Weight help page. The central square primarily serves as a transitional area for the outside triangular plots.
Open the Tasks Pane on the right-hand side of the EnviroInsite interface, select Create Window and then select Durov Plot. Durov plots can also be created by selecting Window> New> Durov Plot from a plan view map. A new view window is generated and the Durov Plot dialog box opens. Modify the plot properties on the Query tab, Select Ions tab, Options tab, Labels tab, Analytes tab, and EQuIS Query tab as desired. Click the OK button to save changes.
For EQuIS EnviroInsite clients, if the diagrams are not displaying as expected, check to see if DT_FACILITY.ELEV_UNIT is populated. If it is not, consider populating this information. Although it is not a required field for this report, it is recommended.