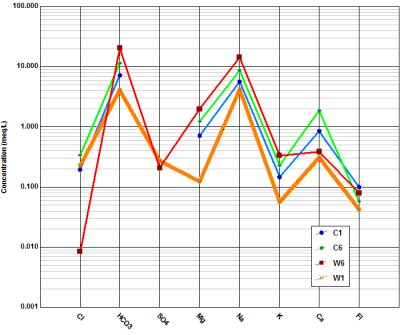
Schoeller diagrams are used to show the relative concentrations of anions and cations typically expressed in milliequivalents per liter. Multiple samples from different wells may be plotted on a single diagram to distinguish similar patterns in the ratios of particular anions and cations. Water concentrations are a function of the groundwater geochemistry and the chemical composition of the aquifer rock material. These patterns may be used to distinguish common or disparate source areas of water drawn from multiple wells.
Open the Tasks Pane on the right-hand side of the EnviroInsite interface, select Create Window and then select Schoeller Diagram. Schoeller diagrams can also be created by selecting Window> New> Schoeller Diagram from a plan view map. A new view window is generated and the Schoeller Diagram dialog box opens. Modify the graph properties on the Query tab, Line Format tab, Left Axis tab, Right Axis tab, Options tab, Format tab, and EQuIS Query tab as desired. Click the OK button to save changes.
For EQuIS EnviroInsite clients, if the diagrams are not displaying as expected, check to see if DT_FACILITY.ELEV_UNIT is populated. If it is not, consider populating this information. Although it is not a required field for this report, it is recommended.
Line Format Tab
The Line Format tab allows specification of the line style and symbol style for each well. Both scalable and non-scaling line styles may be selected. The scalable line scales allow the number of repetitions of the line pattern to be controlled by setting the Pattern Scale. Higher Pattern Scale properties reduce the number of repetitions that are shown in a line segment of a particular length.
Line
•Style
•Pattern Scale
•Color
•Weight
Symbol
•Style
•Radius
•Fill Color
Left / Right Axis Tab
The constituents that are plotted versus the left or right axis are specified in the Query tab. Clicking the Set Default button queries the data and automatically sets the minimum, maximum and axis interval. The other parameters are self-explanatory.
•Title
•Minimum
•Maximum
•First Label
•Interval
•Digits Right of Decimal
•Log Scale
•Scientific Notation
•Grid Lines
•Grid Color
Options Tab
Non-detects that are indicated by a ND in the Flag field of the Observations table can be indicated in the Schoeller Diagram. Check the Use non-detect color box and set the desired non-detect color. The presence of a legend outline and background can also be selected on the Options tab.
Format Tab
Chart
•Height
•Width
•Outline Color
•Background Color
Axes Text
•Style
•Height
Header Text
•Style
•Height