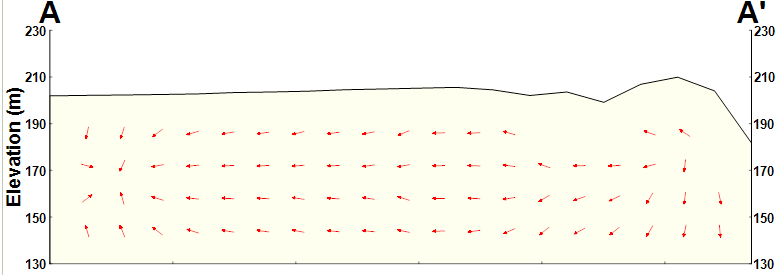
The calculated gradients consist of the component of the gradient parallel to the cross-section line. Gradient directions are depicted with arrows on the cross-section profile. If the gradient direction is horizontal and perpendicular to the cross-section line, then the magnitude of the calculated gradient will be zero and no gradient arrow will be displayed.
To generate gradients on a cross-section profile, click Plot> Water Level from the main menu and select Gradient. The Gradient dialog box opens. Modify the properties on the Query tab, Format tab, Grid tab, Interpolation tab, Legend tab, Virtual Points tab, and EQuIS Query tab as desired. Click the OK button to save changes.
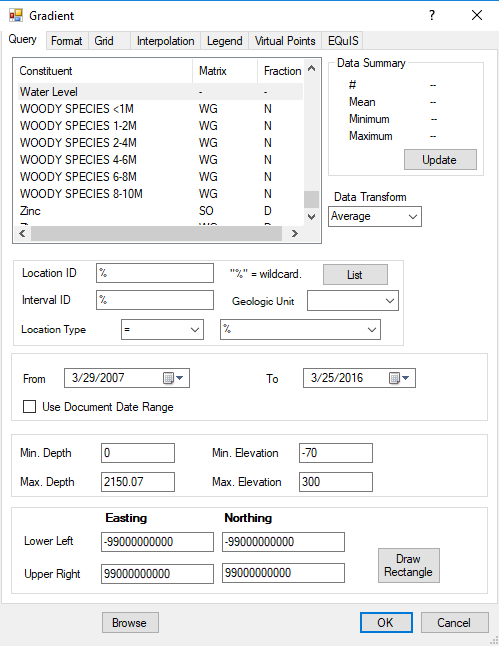
Query Tab
Select the constituent / matrix / fraction that contains the water level to be plotted. For EQuIS users, the water level returned by the EQuIS water level function is obtained by selecting Water Level as the constituent, with "-" as the matrix and fraction.
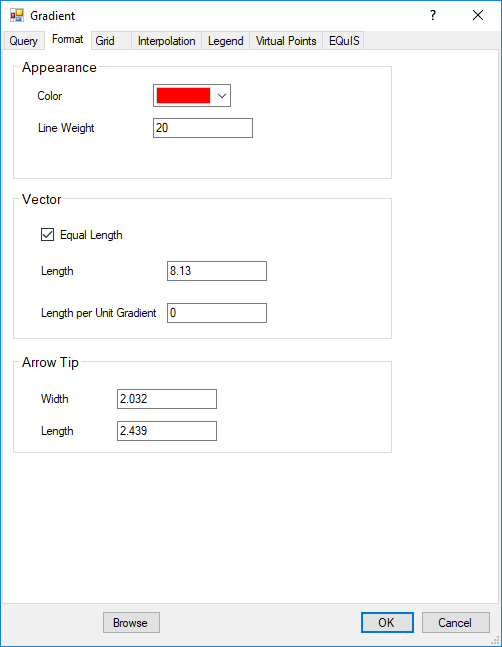
Format Tab
Specify the gradient arrow format. All length values are specified based on the horizontal coordinates. (Proportional-length gradient arrows are not presently supported for cross-section gradient plots.)
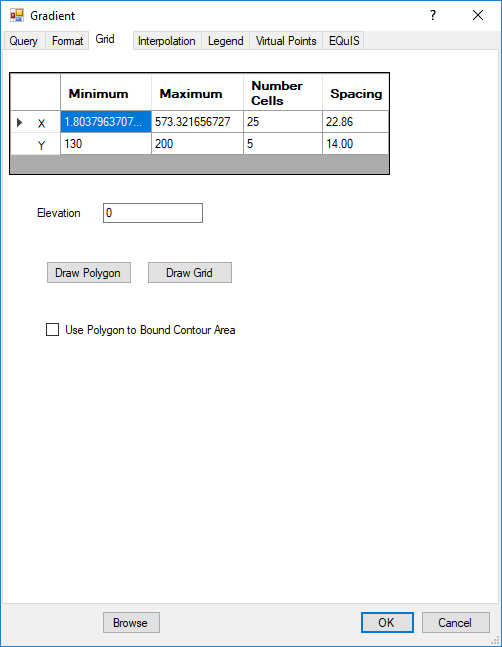
Grid Tab
Specify the mesh boundaries and the number of grid cells in the horizontal (X) and vertical (Y) directions. Gradients are calculated at the node boundaries and are not calculated for node points along the mesh boundary. Therefore, the number of arrows in any mesh row or column will be one less than the number of cells in that row or column.
Interpolation Tab
The gradient values at each mesh point are evaluated by interpolating the measured values onto a rectangular mesh and then calculating the average horizontal and vertical gradient at each of the mesh nodes. The interpolation methods are the same as for the contours. More information on the interpolation methods and options may be gained by consulting the interpolation discussion in the cross-section contour section.
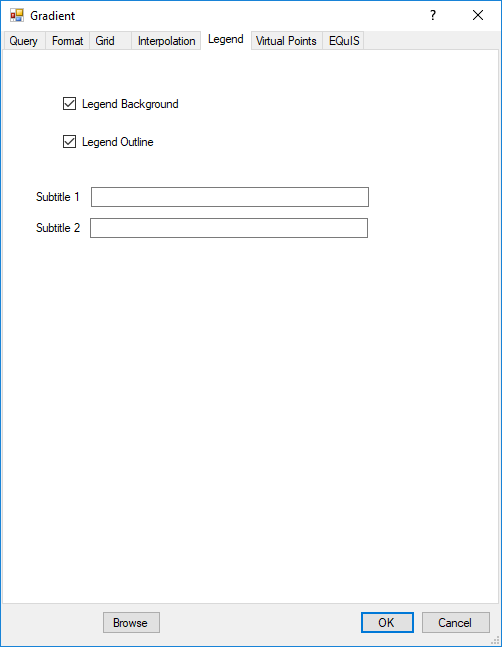
Legend Tab
Set the legend subtitles and indicate whether the legend's rectangular outline and background should be plotted.
Virtual Points Tab
The virtual points option is not available for cross-section gradient plots.
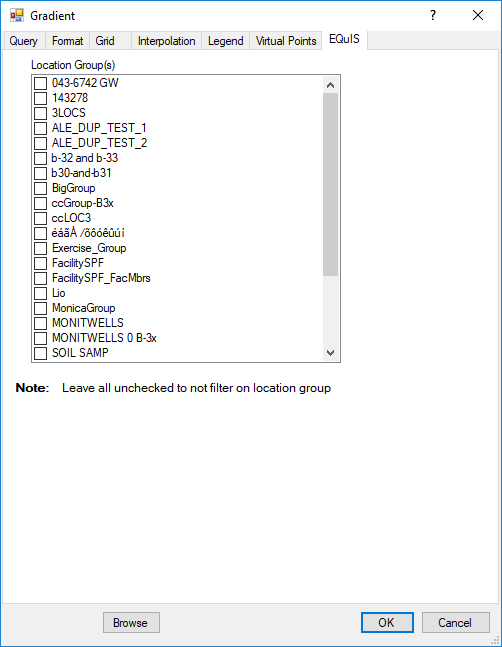
EQuIS Tab
Select one or more Location Group(s) from the EQuIS tab to filter data by Location Groups defined in the EQuIS database. Selecting no Location Groups will result in no filtering being applied based on the Location Group value.