The Downhole Interval plot is used to post soil classification, descriptions, or other properties. These intervals may be filled with hatch patterns based on the contents of the underlying data fields or the text contents of the data fields may be simply plotted. The former are typically used as a visual representation of changes in soil classifications, while the text contents are used to convey text descriptions of various kinds.
Note: If the text does not fit on the current page when plotting downhole interval text in a boring log, the following conditions will apply: •If the interval continues on to the next page, all of the text will be moved to the next page. •If the interval does not continue on to the next page, the first part of the text will be displayed on the current page, an L-shaped line indicator ( |
For non-EQuIS users, the source of data for these downhole plots is the Borings tab or table. The standard data fields or any optional data fields created by the user in the Borings tab are selectable for plotting.
For EQuIS users, selectable data sources include both DT_LITHOLOGY and DT_SAMPLE_PARAMETER. Any one of the the following fields from DT_LITHOLOGY may be selected: REMARK_1, REMARK_2, MATERIAL_NAME, GEO_UNIT_CODE_1, GEO_UNIT_CODE_2, GEO_UNIT_CODE_3, GEO_UNIT_CODE_4, GEO_UNIT_CODE_5, MOISTURE, PERMEABLE, COLOR, OBSERVATION, GRAINSIZE, ODOR, CUSTOM_FIELD_1, CUSTOM_FIELD_2, CUSTOM_FIELD_3, CUSTOM_FIELD_4, or CUSTOM_FIELD_5; or the contents of DT_SAMPLE_PARAMETER.PARAM_VALUE. For DT_SAMPLE_PARAMETER values, the user is presented with the full set of DT_SAMPLE_PARAMETER.PARAM_CODE values from which to choose.
EnviroInsite uses the same method for determining the bottom depth of any interval as is used in VW_LITHOLOGY. By convention, the bottom depth of all intervals except for the lowermost interval is simply the START_DEPTH of the underlying interval. The bottom depth of the lowermost interval for any location is taken to be either the value of DT_LOCATION.TOTAL_DEPTH if that field is populated or the DT_WELL.DEPTH_OF_WELL for those locations where the TOTAL_DEPTH field is not populated. If neither DT_LOCATION.TOTAL_DEPTH or DT_WELL.DEPTH_OF_WELL fields are populated, then the calculated value of the bottom depth will be null and zero out.
Double-click on the desired downhole interval field to add it to the report. Once in the report, double-click the downhole interval object to open the Downhole Interval Data dialog box. Select the Import button (in lower left corner) to import hatch interval descriptions. Modify the Options tab, Format tab, Fill Style tab, Fill Style2 tab, and Text tab as desired. Click the OK button to save changes.
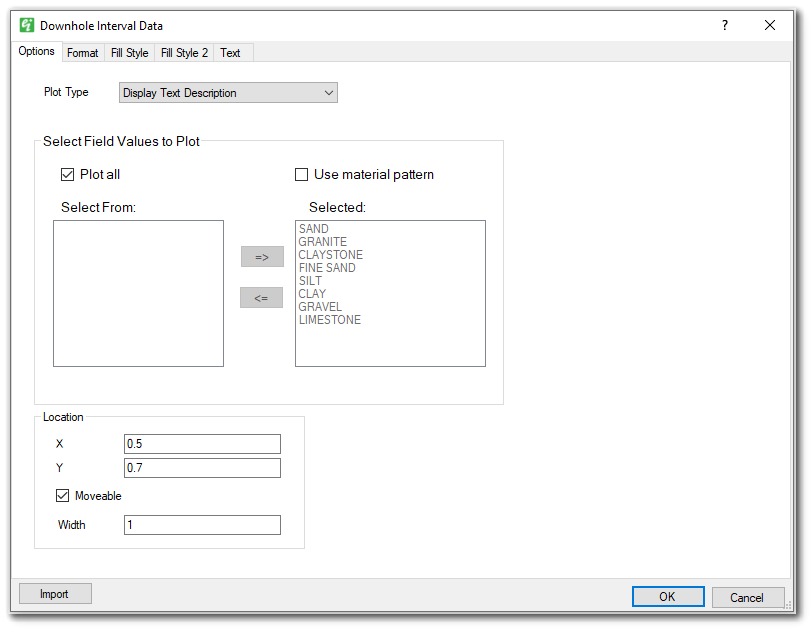
Plot Type – Select the plot type to be used for this downhole interval plot.
Plot All – Check to plot intervals for all field values.
Use Material Pattern – Hatch patterns in a .dxf format may be used in substitution of EnviroInsite’s Fill Styles. To use this option, a .dxf pattern must be uploaded to the DT_FILE table. Assign the DT_FILE.FILE_ID to RT_MATERIAL.PATTERN under the RT_MATERIAL.MATERIAL_NAME to be plotted. The .dxf pattern will inherit the hatch scale and hatch angle from Fill Style. This same scale will be applied to the material legend when it is drawn in Subsurface Profiles.
Select From and Selected – Select field values for which intervals will be generated and move them to the right pane (Selected) using the => button. Alternately, check "Plot All" to select all values.
Location X and Y – Set the interval in inches measured from the left-hand side of the page.
Moveable – Check to allow interval to be moved using the mouse in the Boring Log Template Designer.
Width – Set the interval width in inches.
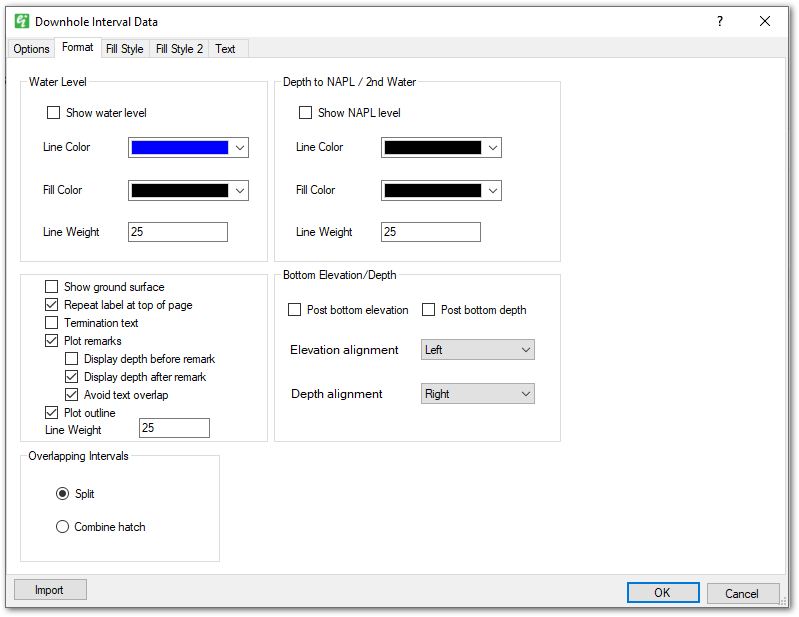
Show water level – Check to plot inverted triangle and line indicating depth of water.
Show NAPL level – Check to plot inverted triangle and line indicating depth of NAPL (or a second water level value).
Line Color / Fill Color / Line Weight – Select format for water/NAPL level triangles and lines.
Show ground surface – Check to add "Ground Surface" description text.
Repeat label at top of page – Check to repeat lithologic data entries on the next page when the data straddles two pages.
Termination text – Check to post termination/refusal text at the bottom of the column. See below for more information.
Plot remarks – Check to plot zero-thickness intervals (START_DEPTH = END_DEPTH) as remark text at its designated depth. When disabled, the record will plot as an independent interval.
Avoid text overlap – Check to shift/move the remark text to avoid overlapping text. This option is only available if Plot remarks is checked.
Display depth before remark – Check to display the depth and units before the remark text. This option is only available if Plot remarks is checked.
Display depth after remark – Check to display the depth and units after the remark text. This option is only available if Plot remarks is checked.
Plot outline – Check to plot outline. When checked, set the Line Weight in tenths of mm.
Post bottom elevation – When enabled, the bottom elevation is drawn on each interval. The alignment settings of “Post bottom elevation” and “Post bottom depth” dictate which side of the column they are drawn. Display of the bottom elevation can be modified at runtime by using a parameter (see Parameter Configurations for Boring Log Data).
Post bottom depth – When enabled, the bottom depth is drawn on each interval. The alignment settings of “Post bottom elevation” and “Post bottom depth” dictate which side of the column they are drawn.
Overlapping Intervals – For intervals that have overlapping depths, select to either split the visual representations (left and right) or to combine them as a single, double-hatched fill area.
Termination text may be added to the end of a boring log by enabling the Termination Text option in a Downhole Interval Data column options menu. The default text is "Boring terminated at {depth} {unit}". The {depth} value is taken from DT_LOCATION.TOTAL_DEPTH if that field is populated or the DT_WELL.DEPTH_OF_WELL. The {unit} value defaults to “feet” but can be edited in the Boring Log Template Design dialog > Edit > Options > Options tab. Termination and refusal text can be modified at runtime by using a parameter (see Parameter Configurations for Boring Log Data).
Fill Style / Fill Style 2 Tabs
The Fill Style and Fill Style 2 tabs allow users to modify the display options for a particular soil type (or lithologic description). Select a soil type in the list box and then modify the hatch and color using the dialog controls to the right. Use the up and down arrows to scroll through soil types. Soil types can be removed in the list by clicking the "X".
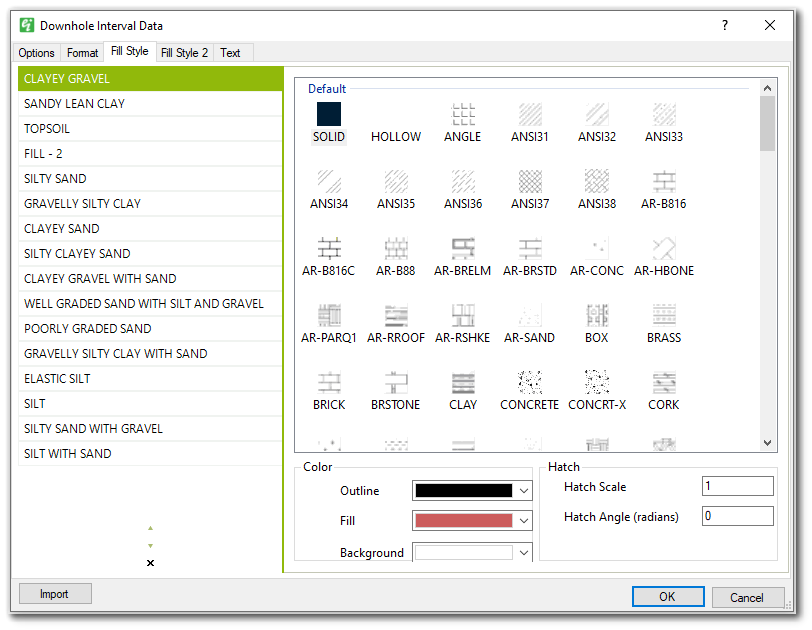
Color – Select the Outline, Fill, and Background colors for the active lithologic description. The background color can be set to transparent to allow columns below the hatch pattern to be visible.
Hatch Scale – Enter the hatch scale. Note that too small of a value may result in a solid fill with hatch line color.
Hatch Angle – Set the hatch angle (in radians) to rotate the hatch pattern.
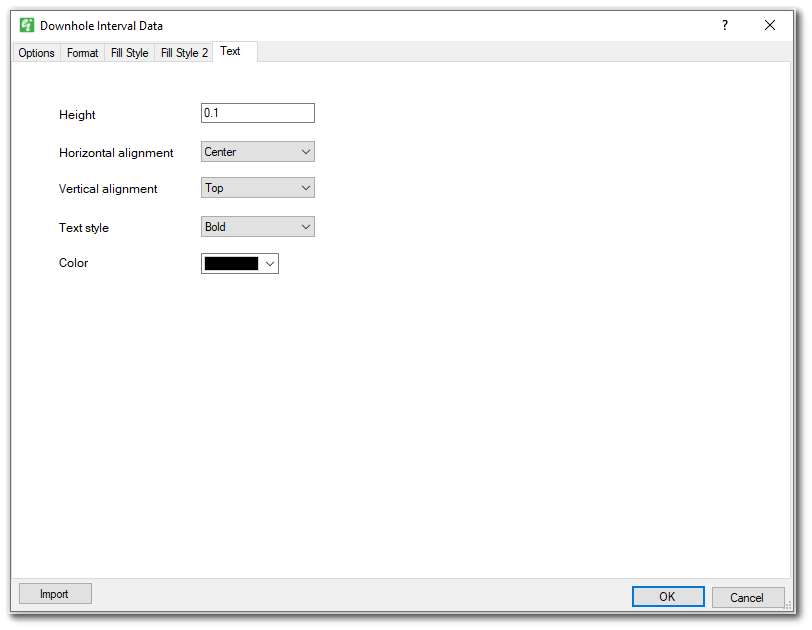
Height – Text height in page coordinates (inches).
Horizontal alignment – Select from either left, center or right alignment of text strings.
Vertical alignment – Select from either top or vertical center alignment of text strings.
Text style – Select text style.
Color – Select text color.