Boring Log Report options may be modified by selecting Edit > Options from the Boring Log Template Design window. The Log Plotter Options dialog box opens. Modify properties on the tabs as desired:
Click the OK button to save changes.
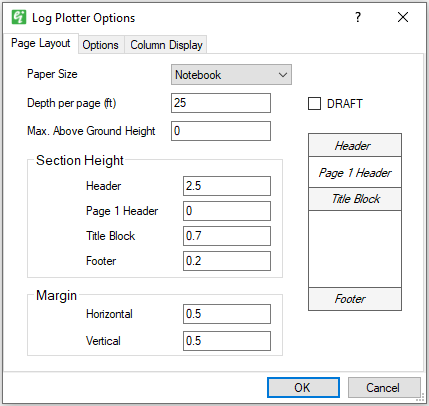
Depth per Page – Depth of well, in feet, to be plotted per page. To assign a metric value, convert the value to feet. For example, to have page breaks be every 10 meters, the value should be 32.8084. Note that the Page 1 Header height will reduce the amount of depth plotted on the first page. The "Depth per Page" can be modified at runtime by using a parameter (see Parameter Configurations for Boring Log Data).
Max. Above-Ground Height – This specifies the above ground height shown on the log to display casings that stick up above the ground surface.
Section Height – Height of log report sections in inches. The Footer section is placed at the bottom of the page and the downhole section height is set to the remaining space between the Title Block and Footer sections. Page 1 Header height will reduce the amount of depth plotted on the first page.
•Data Header
•Page 1 Header
•Title Block
•Footer
Margin – Page margins in inches.
Draft – When checked, the text "DRAFT" will be displayed diagonally across the center of each page of the plotted boring logs.
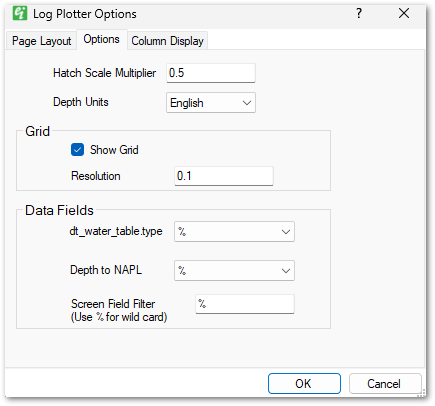
Hatch Scale Multiplier – All of the hatch patterns in the log are multiplied by this scale to provide for global control over the hatch pattern scales.
Depth Units – Indicates depth units displayed on the axes and other locations. If depth units are not specified in the designer or in the template, then the units are set to DT_FACILITY.ELEV_UNIT or DT_LOCATION.UNITS.
Grid > Show Grid – Check to show the grid in the Boring Log Template Design window. All objects will snap to the grid points.
Grid > Grid Resolution – Spacing of the grid points in the Boring Log Template Design window.
Data Fields > Depth to Water (non-EQuIS database users) – Select data field from Wells table that will be used for display of depth to water. This field is used in the downhole plots, where the depth to water has been elected to be plotted.
Data Fields > DT_WATER_TABLE.TYPE (EQuIS users) – Select from the populated values of DT_WATER_TABLE.TYPE, to select DT_WATER_TABLE records deemed to be representative of the depth to water. All water depth values are presumed to be relative to the top of casing elevation specified in DT_WELL.TOP_CASING_ELEV.
Data Fields > Depth to NAPL – Select data field from Wells table that will be used for display of depth to NAPL. This field is used in the downhole plots, where the depth to NAPL has been elected to be plotted.
Data Fields > Screen Field Filter – Field for selection of displayed screens. This allows only a subset of the Screens table records to be used in drawing the screen in the Well Construction downhole plots. This might be useful when records in the Screens table contain sample intervals from a soil boring.
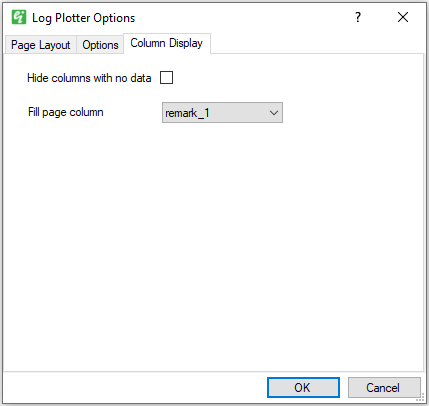
Hide columns with no data – When enabled, columns with no data across all selected wells will not draw in the resulting boring log output.
Fill page column – Drop-down will populate with the names of currently active data columns. When set, the selected column will resize to fill any remaining page space when the boring log is drawn.