EnviroInsite supports the plotting of database functions in Boring Logs or Subsurface Profiles. Functions that are appropriately configured and stored in the EQuIS database will be available in the Functions tab in the right pane of the Template Design window. Each function name must begin with "ei_". EQuIS SQL functions may be used to plot data as header/footer text or plot downhole data as boring log columns. The SQL functions can also control the formatting of downhole text and insertion of graphics in boring log headers and columns. See the Database Functions Used in EnviroInsite article for function configuration details.
To add a function from the Function tab in the Boring Log Template Design window or Subsurface Profile Template Design window, either double-click one of the functions or select the function and drag it into place on the template page. Functions can be added from the Header/Footer Function Data or the Downhole Function Data sections of the Functions tab.
Once placed, the function content format may be modified by double-clicking on the placed element or right-clicking on the element and selecting Edit to open the Function Data dialog box.
Header Function Data
Modify properties on the Header Function Data window tabs as desired:
This tab is used to specify the text format properties.
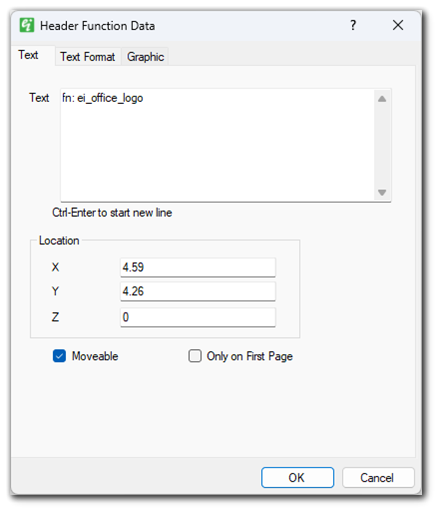
Text – The text representation of the selected function.
X – Specify the X position of the text.
Y – Specify the Y position of the text.
Z – Specify the Z position of the text.
Moveable – Check to allow the object to be moved using the mouse.
Only on first page – Check to allow the object to be drawn only on the first page.
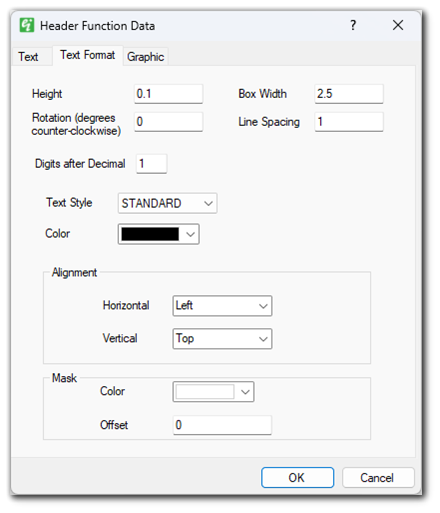
Height – Specify the text height in inches.
Box Width – Specify the width of the text box.
Rotation (degrees counters-clockwise) – Rotates the function counter-clockwise by the value set in degrees.
Line Spacing – Specify the space between each line of the text.
Digits after Decimal – Enter the number of digits after the decimal; only applies to fields that contain numeric content.
Text style – Select the text style. The text styles are defined as document properties.
Color – Select the text color.
Alignment – Select text string’s horizontal and vertical alignment relative to insertion point.
Mask Color – Select background mask color.
Mask Offset – Enter mask offset as fraction of text height.
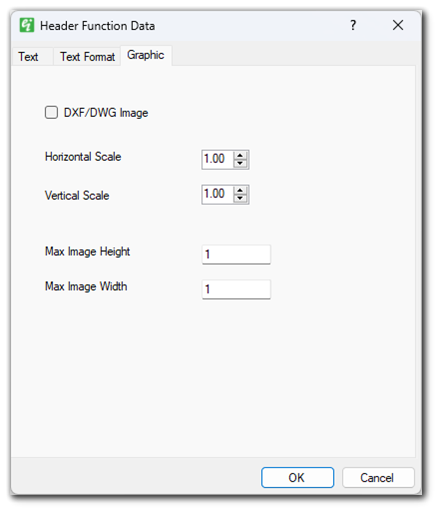
DXF/DWG Image – Check to indicate that the graphic being drawn is of the DXF/DWG formats.
Horizontal Scale – Set the horizontal scale of graphic function image. One (1.0) is the full width of the column.
Vertical Scale – Set the vertical scale of graphic function image. One (1.0) is the full height of the column.
Max Image Height – Enter the maximum image height in inches.
Max Image Width – Enter the maximum image width in inches.
Downhole Function Data
Modify properties on the Function Data window tabs as desired:
This tab is used to specify the text format properties.
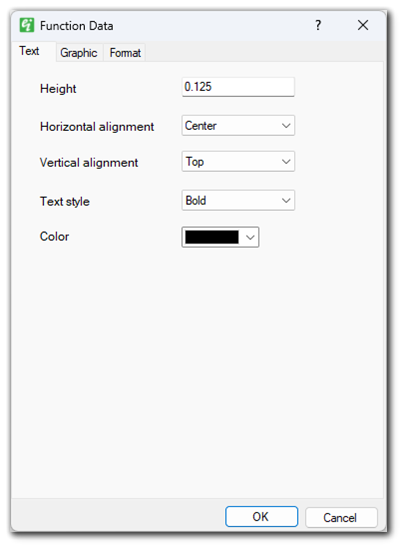
Height – Specify the text height in inches.
Horizontal alignment – Select the horizontal alignment.
Vertical alignment – Select the vertical alignment.
Text style – Select the text style. The text styles are defined as document properties.
Color – Select the text color.
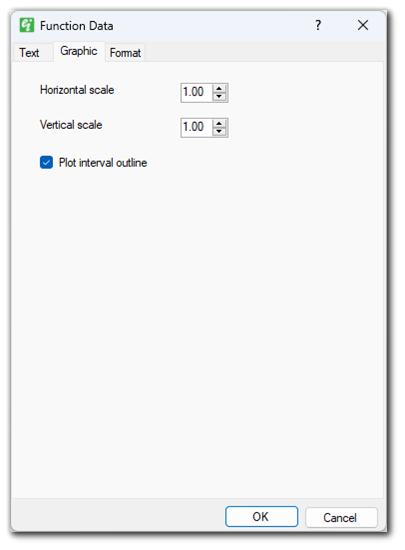
Horizontal scale – Set the horizontal scale of graphic function image. One (1.0) is the full width of the column.
Vertical scale – Set the vertical scale of graphic function image. One (1.0) is the full height of the column.
Plot interval outline – Check to plot boundaries of each interval.
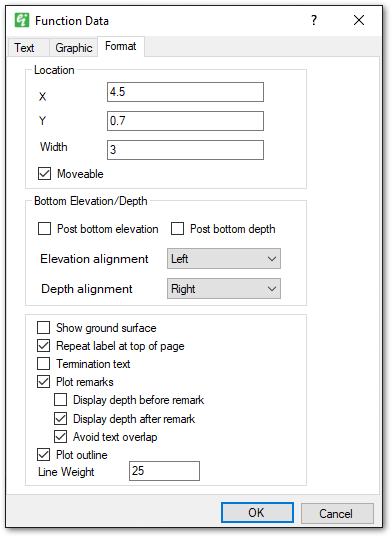
X – Specify the X position of the column.
Y – Specify the Y position of the column.
Width – Specify the width of the column.
Moveable – Check to allow the object to be moved using the mouse.
Post bottom elevation – Check to plot bottom elevation of each interval.
Post bottom depth – Check to plot bottom depth of each interval.
Elevation alignment – Select bottom elevation alignment.
Depth alignment – Select bottom depth alignment.
Show ground surface – Check to plot ground surface label.
Repeat label at top of page – Check to repeat label at top of page when interval present in subsequent pages.
Termination text – Check to plot refusal type.
Plot remarks – Check to plot zero thickness intervals as remark.
Avoid text overlap – Check to shift/move the remark text to avoid overlapping text. This option is only available if Plot remarks is checked.
Display depth before remark – Check to display the depth and units before the remark text. This option is only available if Plot remarks is checked.
Display depth after remark – Check to display the depth and units after the remark text. This option is only available if Plot remarks is checked.
Plot outline – Check to plot the outline of the column.
Line weight – Set the thickness of column outline.