•Downhole Groups and Visibility
The Boring Log Template Design window enables the user to create new boring log templates or modify existing templates. To access the Boring Log Template Design window:
1.Open the Tasks Pane on the right-hand side of the EnviroInsite interface.
2.Select Create Window and then select Boring Logs. A new view window is generated.
3.Select Plot> Logs or Logs from Template and the Select Borings dialog box opens.
4.Highlight the desired boring locations and click the => button to move the boring locations to the Selected pane.
5.Click OK. The Boring Log Template Design window will open.
Notes: •Font styles used in the boring logs are defined as document properties and set in the Text Style window. •Supported image types that can be inserted into Boring Log templates, via the Insert menu drop-down, include: oBMP oGIF oJPEG oPNG oTIFF |
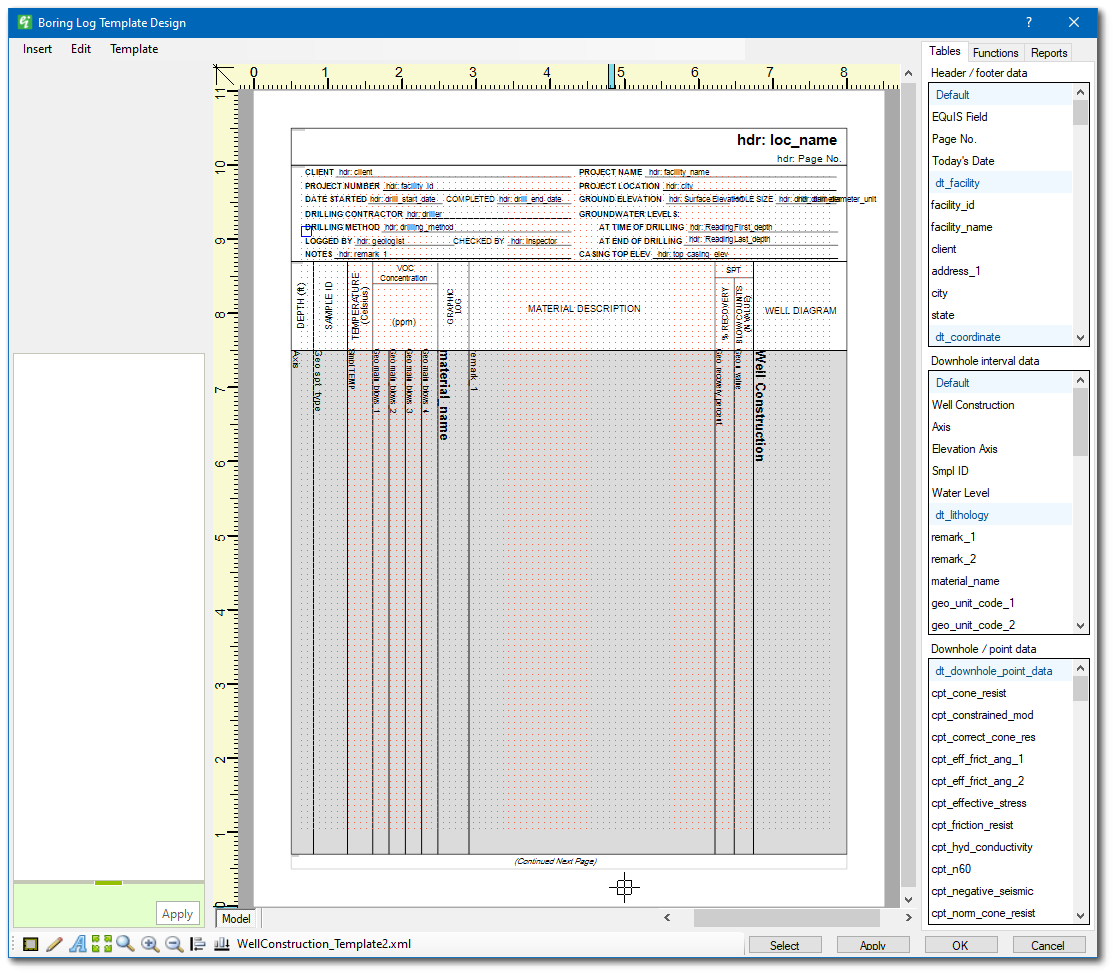
The Tables tab on the Boring Log Template Design window is used to select the data fields to be plotted and to design the layout of the page. The fields are selected from the lists at the right of the window. Each of the lists are derived from a different table or field set. The table names highlighted in blue serve as section dividers and may not be added to a template design.
For EQuIS users, the source tables and fields are described in the Tables and Fields used in Generating Full-Page Boring Logs article.
For non-EQuIS users, the source data for each type of interval is as follows:
Header / Footer Data |
Fields of Wells Table |
Downhole Interval Data |
Fields of Borings Table |
Downhole / Point Data |
Contents of Constituents Field in Point Values Table |
Fields are added to the Boring Log Template Design window by double-clicking on the field name or by selecting a field and dragging and releasing it at the desired location on the template. Once placed on the Boring Log Template Design window, fields may be dragged using the mouse to the desired location.
Where present (e.g., Header/Footer Data | dt_drill_activity | Select drill_event), drop-down menus enable filtering data sources by selected values in the database (all facilities). To use this feature, select the drop-down menu and choose the desired value and then add related fields to the template. The field placeholder names that are added to the layout are prepended with the filter value (e.g., "hdr: INITIAL_drill_start_date" for the start_date of INITIAL drill event). Change the filter selection, then add related fields to the template again as desired. This enables including multiple records of the same field related to different events (e.g., data from multiple drill events may be grouped and displayed together). If no option is selected from the drop-down, the template will use a default record.
Multiple objects may be selected in the template by holding the SHIFT key and clicking the desired objects. The grouped objects may be moved around the template by again holding the SHIFT key, then clicking and dragging the group.
Selected objects may also be aligned with right-click> Align> Left or Bottom. The objects are aligned based on the placement of the blue object box that is displayed when an object is selected. The placement of the blue object box may be changed in the Alignment section of the Properties window.
When an object is selected in the Boring Log Template Design window, that object's properties are populated in the Properties window in the bottom-left corner. Double-clicking on a placed object in the Boring Log Template Design window opens a pop-up context-sensitive Properties window. The object properties can be modified in either the Properties window or the pop-up Properties window. Data fields added to the main body of the template will generate an associated title block for the data. This block and its text may be toggled off in the properties menu of the data object.
The Functions tab on the Boring Log Template Design window will display all EnvironInsite functions appropriately configured and stored in the EQuIS database. Each function name must begin with "ei_". EQuIS SQL functions may be used to plot data as header/footer text or plot downhole data as boring log columns. The SQL functions can also control the formatting of downhole text and insertion of graphics in boring log headers and columns.
See the Database Functions Used in EnviroInsite article for function configuration details.
Note: If the column_header is populated in the SQL function and there is no data for that column in the boring log, then that column_header will not display. The user must create a Title Text of the column in their boring log template to avoid this problem. |
|---|
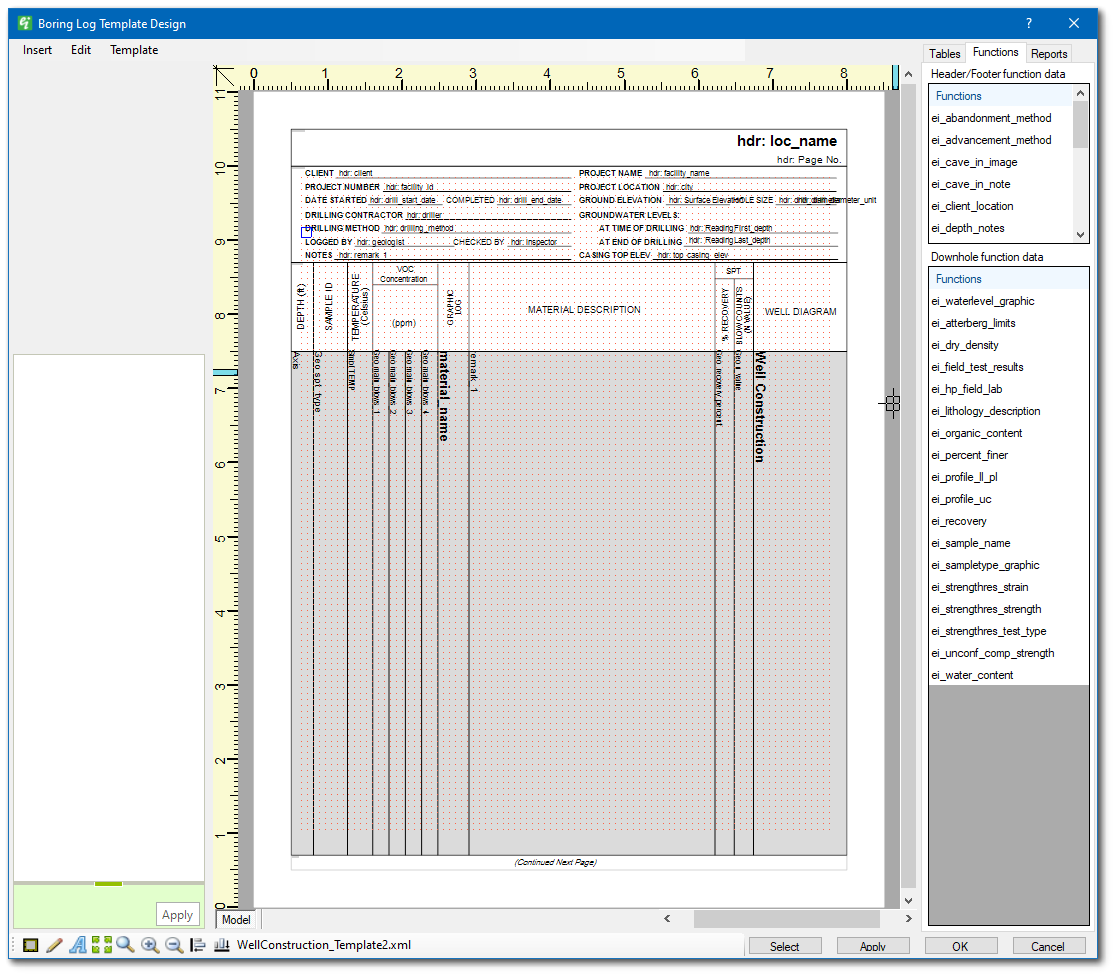
To add a function from the Function tab, either double-click one of the functions or select the function and drag it into place on the template page. Functions can be added from the Header/Footer Function Data or the Downhole Function Data sections of the Functions tab. Once placed, the function content format may be modified by double-clicking on the placed element or right-clicking on the element and selecting Edit to open the Function Data dialog box. See the Function Options article for more information.
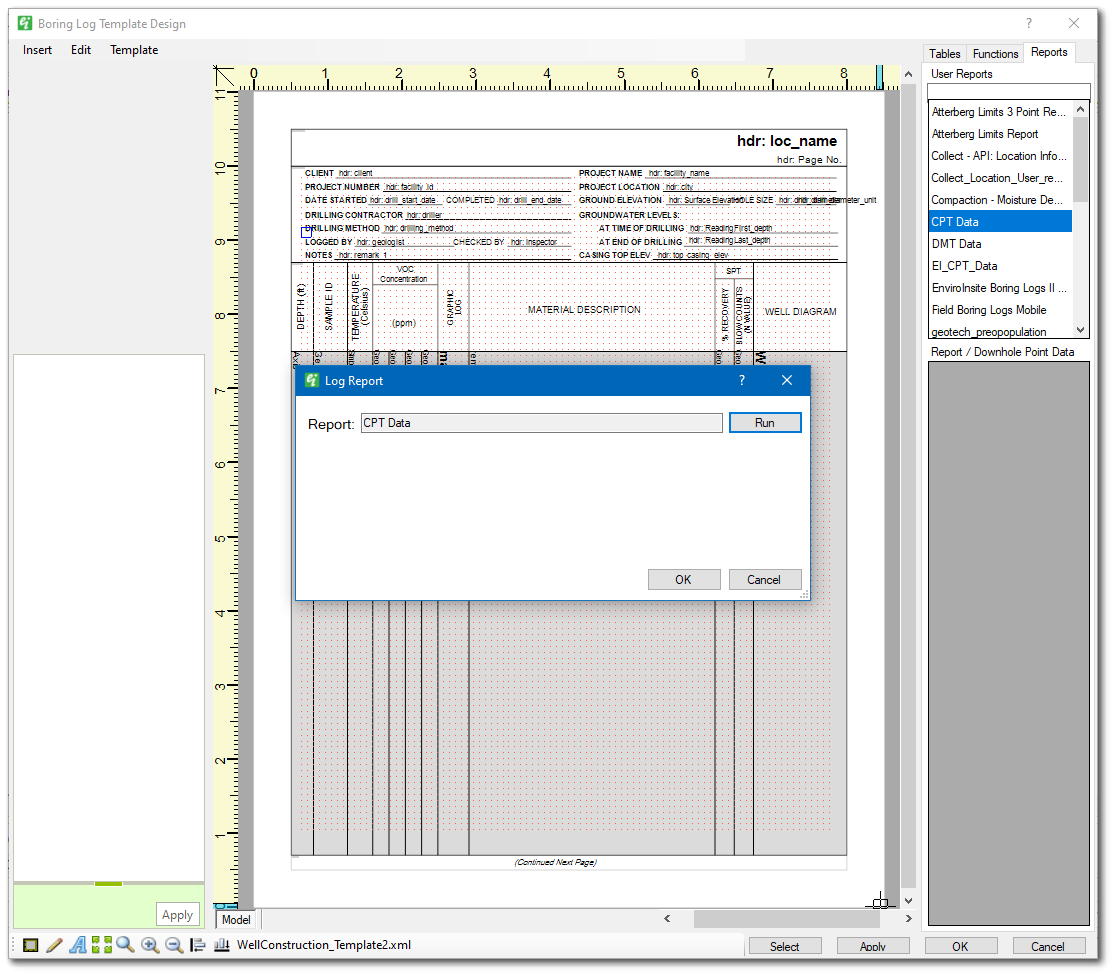
The Reports tab on the Boring Log Template Design window enables users to run saved user reports and display the data as downhole point data. The report must be a function report that produces a data table with the columns ‘sys_loc_code’, ‘depth’, and ‘depth_unit’. Only reports to which the user has permission to will be available for selection.
To run the report, select and double click the report name from the User Reports section on the Reports tab. This will open the Log Report dialog window with the selected user report automatically populated. Click the Run button to execute the report. If an error occurs, then a message will be displayed in the dialog window.
After the selected report successfully runs, the report output columns will be displayed in the Report/Downhole Point Data section. These columns can then be selected and added to the Boring Log Template Design window as shown below.
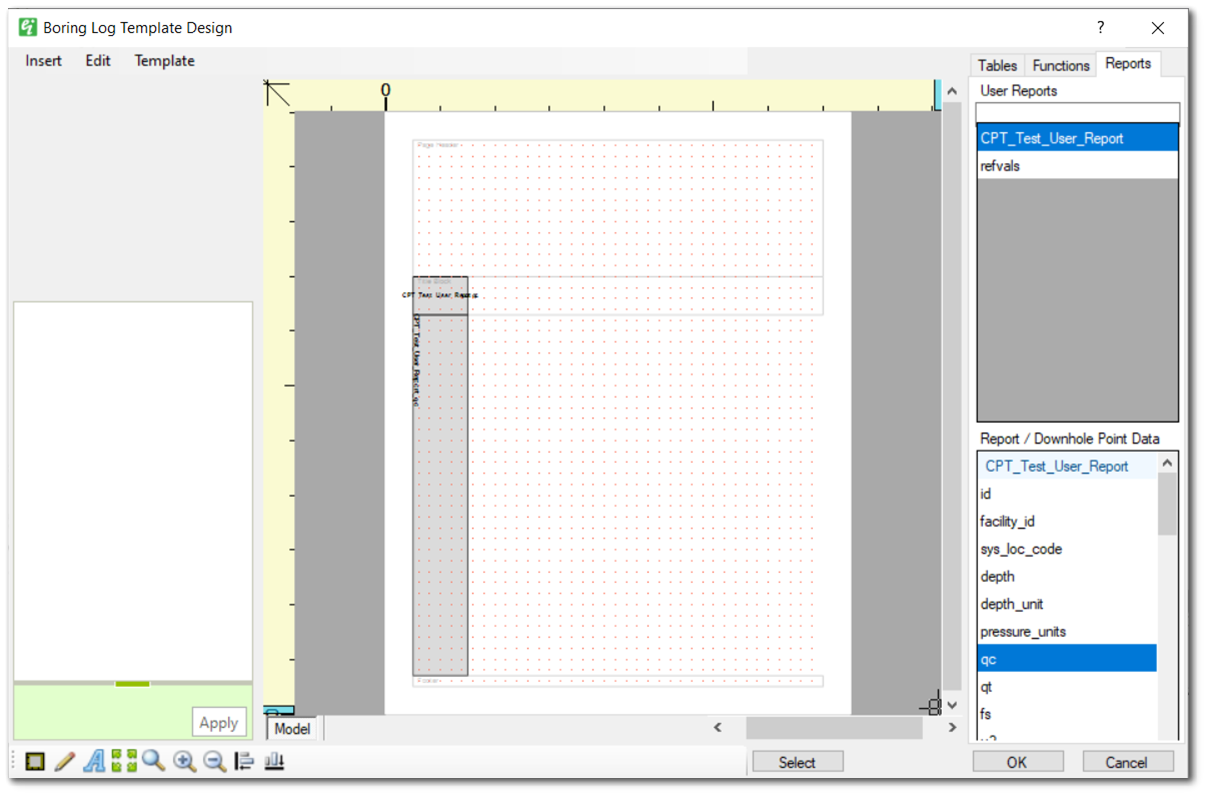
Note: Report data will be displayed as Downhole Point Data with the same options available for selection. The Multi-Data Chart supports plotting charts with multiple fields from the report. EnviroInsite will pull the data directly from the report output and will further filter this data based on user selections. To display the data, the column must produce numeric output. |
|---|
Downhole Groups and Visibility
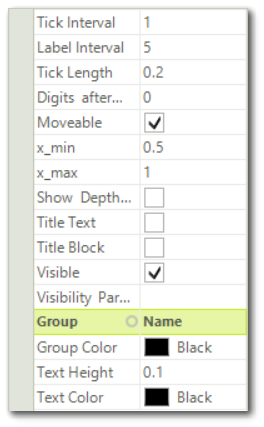
In the properties of a Downhole Interval Data or Downhole / Point Data object, the visibility of an object may be turned off for the plotted boring logs without the need to remove the object from the template completely. Groups and group colors may also be assigned to organize data objects. To create a group, select a column to be included in the group from the Boring Log Template Design. On the left hand side, type the name of the group in the blank field next to the Group property. This will create the group. When other columns are selected, the name of the group will be available from the Group drop-down and can be assigned to that group.
If an object within a group has its visibility unchecked, any remaining contiguous group members will resize automatically to fill the space of the disabled object. Title blocks for each data object will similarly resize to stay in line with the data fields. If a group is unassigned, its group color will reset to black.
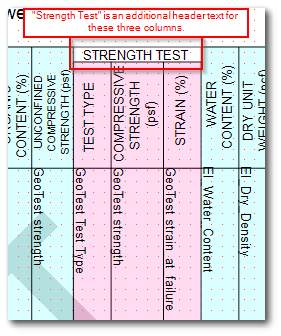
When a visibility parameter is assigned to a column on the boring log and that column has an additional text/line associated with it, then the user must assign a group to this column so that the additional text/line is removed when the visibility for the column is turned off. For example, in the image below "Strength Test" is a header associated with three columns (Test Type, Compressive Strength, and Strain). These three columns are assigned a visibility parameter and are grouped together (shown in pink). When the visibility parameter is turned off for these three columns, then the "Strength Test" header is also removed.
Visibility settings for Downhole Interval Data and Downhole / Point Data objects may be overridden using the PARAM_CODEs in the DT_TASK_PARAMETER and DT_FACILITY_PARAMETER tables. Visibility settings in DT_TASK_PARAMETER will take precedence over visibility settings in DT_FACILITY_PARAMETER if the PARAM_CODEs are identical. To use these PARAM_CODEs as EnviroInsite visibility settings, see the Parameter Configurations for Boring Log Data article.
Note: Apart from the field not displaying in the boring log, there is no visual indicator within EnviroInsite that this override designation has been set in the DT_FACILITY_PARAMETER table. PARAM_CODEs may be assigned to Downhole Interval Data and Downhole / Point Data objects in their properties under the “Visibility Parameter” drop-down. |
Downhole field box widths may be resized by selecting the box and dragging the corner sizing rectangles.
Columns added to a template designer can be moved or re-sized after a column is selected. To select a column, place the cursor inside the column and use a single click. To deselect a selected column, click the ESC button or click outside of the column.
A selected column will display several grips (i.e., blue boxes) which allow a user to move the entire column or change the column width, column header height, and/or column header text position. Placing the cursor within the column, but not on a grip or over text within the column, allows a user to move the column (horizontally only) to a different location without changing the size of the column. Placing the cursor over a grip displays a "move" cursor and allows the user to adjust either the width, header height, or header text position depending on which grip is being used.
Examples and Usage:
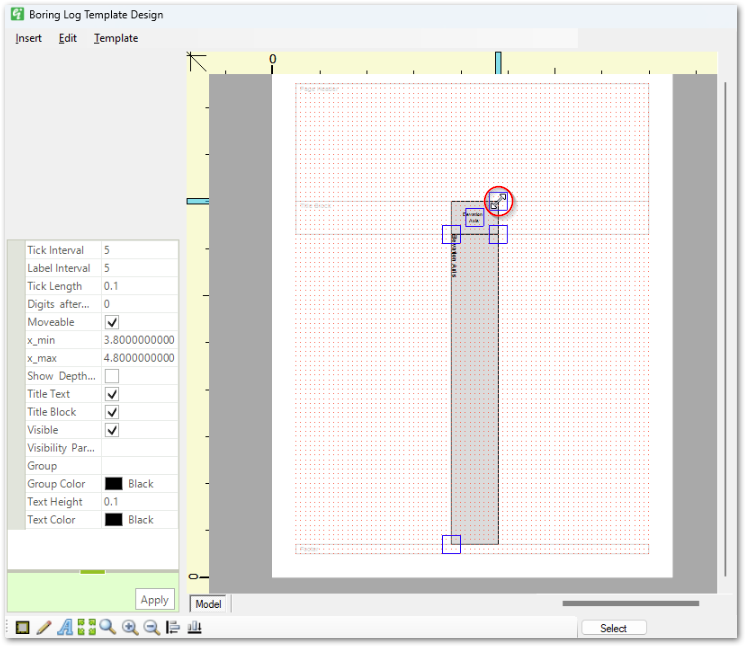
The screen capture below shows a selected column with the move cursor (circled in red) displayed. This scenario allows a user to move the column to any location within the template designer grid area. The same move cursor is also displayed when hovering over the grip for the column header text box and allows a user to move the text box within the header area.
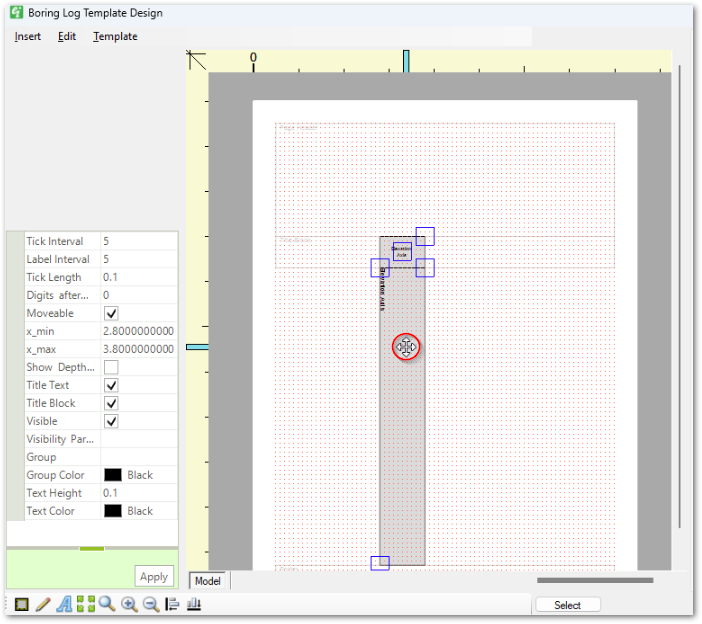
Notes: •Moving a selected column outside of the template designer grid area will result in the column being repositioned within the grid area. •The grip at the bottom left corner of a selected column does not work to re-size the column. |
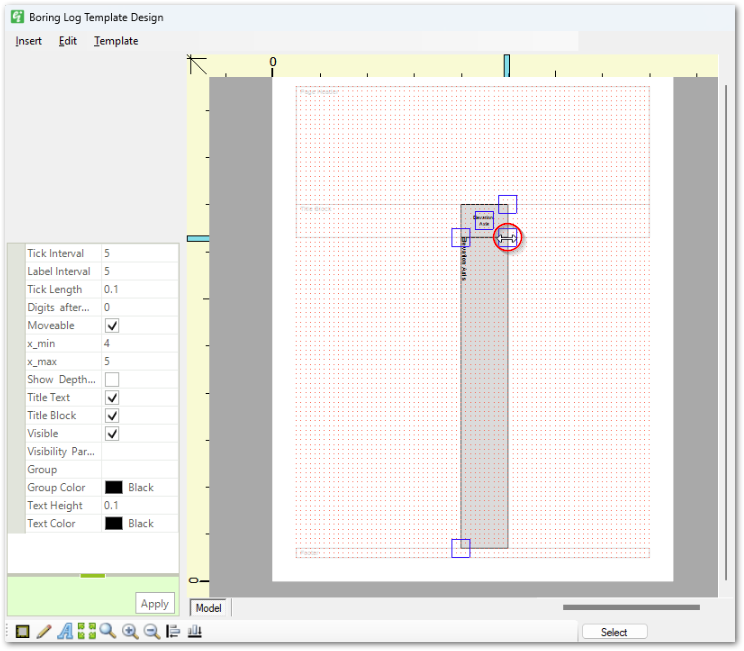
The screen capture below shows the cursor (circled in red) for adjusting the width of the selected column. When the cursor is placed over a grip on the side of the selected column, a user can change the width of the column.
The screen capture below shows the cursor (circled in red) for adjusting the height and/or width of the selected column.
A control bar at the bottom of the page enables users to zoom to the window extent, zoom to a window, or pan within the page. Images, lines, text, and rectangles may be added to a log report by selecting the appropriate button on the control bar at the bottom of the page.
When the boring log report design is complete, save the design to a template by selecting Template>Local> Save or click OK to draw the boring log for the selected locations. Clicking the Select button opens a window to allow selection of locations. If no locations are selected, then all locations will be plotted.
Templates can be saved locally as .xml files by selecting Template> Local> Save or Save As. Saved templates can be opened by selecting Template> Local> Open and choosing a local template.
Templates can be saved to the database by selecting Template> Database> Save or Save As when connected to an EQuIS database. To open a template saved to the database, select Template> Database> Open. The grid will populate with templates (.xml files) saved in DT_FILE. Select a template and click OK to load the template in the Boring Log Template Designer.
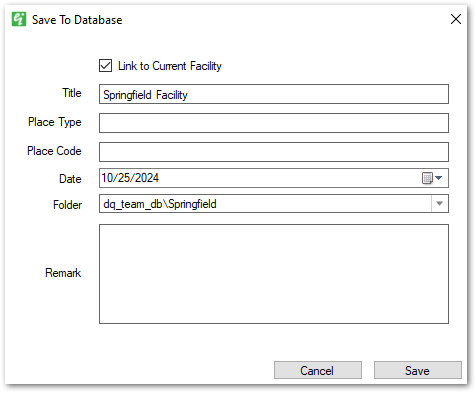
Link to Current Facility: Links the template to the current facility when checked. To share a template with other facilities in the database, deselect this option.
Title: The name of the template. Required.
Place Type: Optionally set the place type.
Place Code: Optionally set the place code.
Date: Set the template date. Required.
Folder: Select the folder where the template will be saved. Default to facility when Link to Current Facility is checked.
Remark: Optionally add a remark.