Double-click on the axes field to add it to the report. Once in the report, double-click the axes to open the Axes dialog box. Modify the tabs as desired:
Click the OK button to save changes.
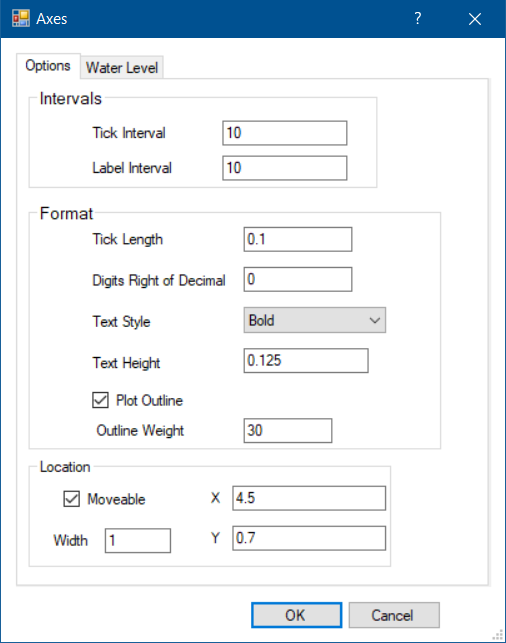
Tick Interval – Interval between axis tick marks.
Label Interval – Interval between axis depth labels.
Tick Length – Display length of the axis tick marks in display units.
Digits Right of Decimal – The number of digits to the right of the decimal in the axis depth labels.
Text Style – Text style of axis labels.
Text Height – Text height for axis labels in page coordinates (inches).
Location X and Y – Enter the location in inches measured from the left-hand side of the page.
Moveable – Check to allow to be moved using the mouse in the Boring Log Template Designer.
Width – Enter the width in inches.
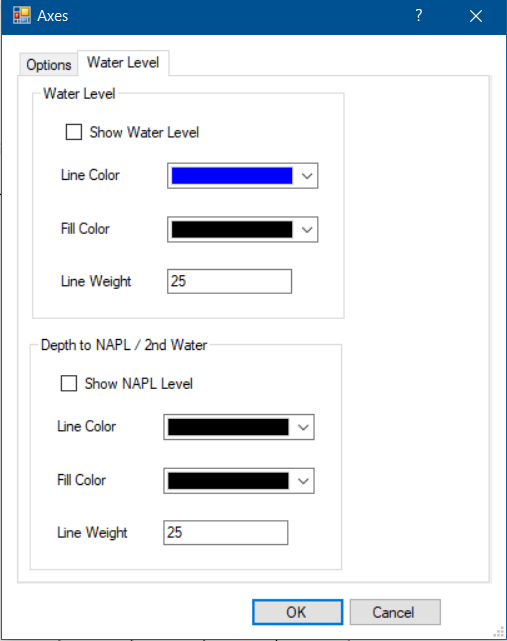
Show Water Level – Option to elect to display the NAPL level on the axis plot as inverted triangle. The depth to NAPL must be stored as a field in the Wells table (for an EnviroInsite database) or a selection from DT_WATER_TABLE.TYPE (for an EQuIS database). The field containing the depth to NAPL is specified in the Log Plotter Options dialog box.
Show NAPL Level – Option to elect to display the NAPL level (or a second water level) on the axis plot as inverted triangle. The depth to NAPL must be stored as a field in the Wells table. The field containing the depth to NAPL is specified in the Log Plotter options dialog box.