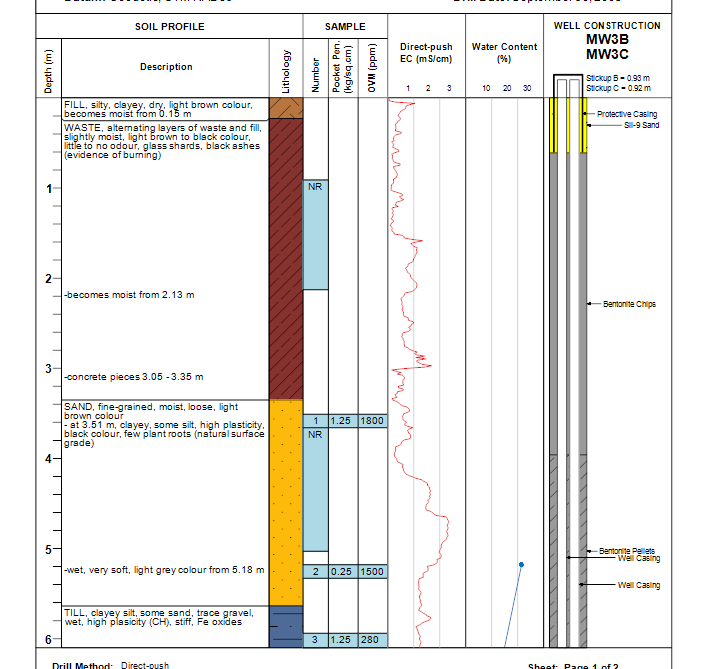
EnviroInsite can shade in the interval occupied by a particular sample interval and plot data values associated with that interval. This might include hammer counts, fracture density, text descriptions of sample lithology, or other geotechnical properties. In the example below, the sample Number, Pocket Pen value, and OVM value are recorded and presented using the sample interval plots.
Sample intervals are added to the downhole space for plotting by either double-clicking on the list of downhole intervals on the right side of the boring log template designer or dragging from there into the downhole space. Sample interval fields are indicated in the list of downhole interval data by Smpl followed by the field name.
For users of the conventional EnviroInsite database, data values to be associated with particular sample intervals can be drawn from optional fields in the Intervals data table. These optional fields are simply created by entering a column header and entering data values in the cells that fall below that header.
For EQuIS users, data values are accessed from the PARAM_VALUE field of DT_SAMPLE_PARAMETER. The vertical interval occupied by the sample is defined by DT_SAMPLE's START_DEPTH, END_DEPTH, and DEPTH_UNIT. Select the Smpl - ID as the downhole interval to be plotted to simply label the intervals with the sample ID. The ID label is drawn from the first non-null value of either DT_SAMPLE.SAMPLE_NAME or DT_SAMPLE.SYS_SAMPLE_CODE.
Double-click the Smpl ID object to open the Sample Interval dialog box. Modify the Format tab, Text tab, and Water Level tab as desired. Click the OK button to save changes.
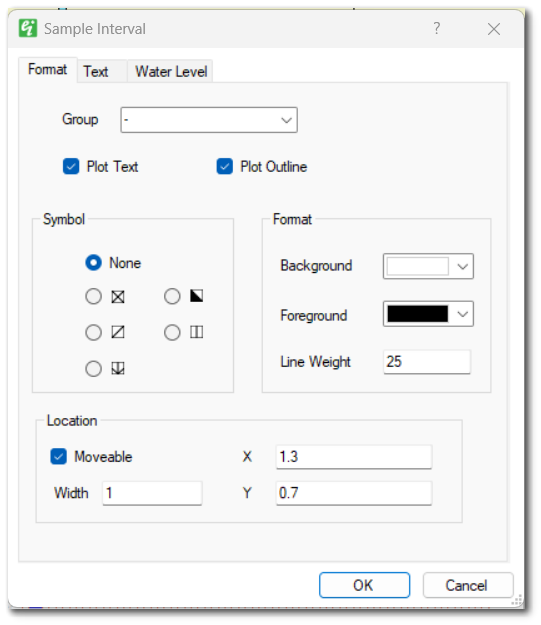
Group – Select the group value on which to filter data (for non-EQuIS users).
Plot Text – Check to plot the selected value.
Plot Outline – Check to plot outline around downhole area.
Symbol – Select the symbol used to fill the interval area.
Format Background – Select the fill background color.
Format Foreground – Select the interval outline color.
Line Weight – Enter the line weight in tenths of mm.
Moveable – Check to allow interval to be moved using the mouse.
Width – Enter the interval width in inches.
Location X and Y – Enter the left-hand edge of the sample interval (in inches measured from the left-hand side of the page).
This tab is used to specify the text format properties.
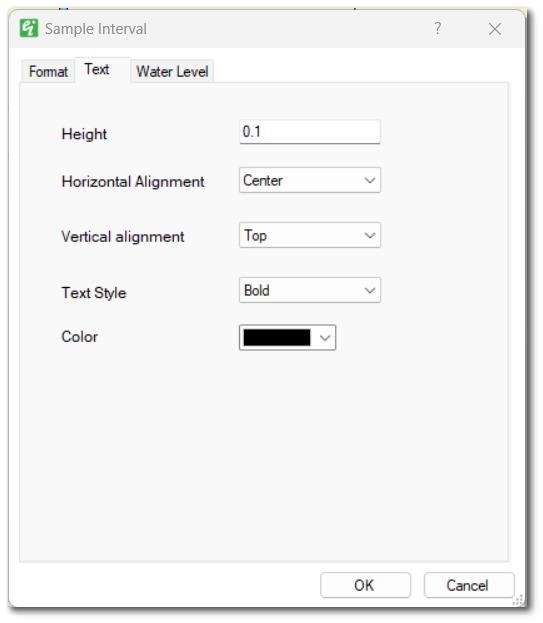
Height – Enter the text height in inches.
Horizontal Alignment – Select the horizontal alignment.
Vertical Alignment – Select the vertical alignment.
Text Style – Select the text style. The text styles are defined as document properties.
Color – Select the text color.
Users may opt to show a water level and a non-aqueous phase liquid (NAPL) level within a sample downhole plot. For EQuIS users, DT_WATER_TABLE.TYPE is used to return NAPL levels; the field containing the depth to NAPL is specified in the Log Plotter Options dialog box. For non-EQuIS users, the water level depth is stored in the optional data fields created in the Locations tab. The field name may be selected from the Boring Log Template Design window. Select Edit> Options and go to the Options tab. Select the Depth to Water and Depth to NAPL fields.
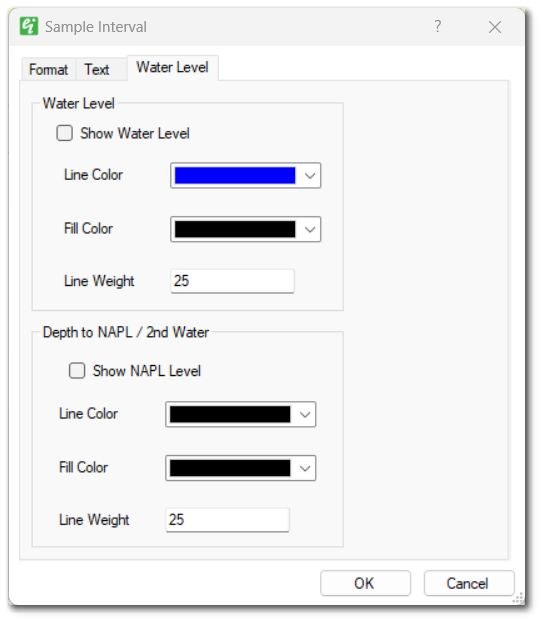
Show Water Level – Check to plot inverted triangle and line indicating depth of water.
Line Color – Select water level line color.
Fill Color – Select the triangle fill color for water level.
Line Weight – Enter line weight in tenths of mm.
Show NAPL Level – Check to plot inverted triangle and line indicating depth of NAPL (or a second water level value).
Line Color – Select NAPL level (or second water level) line color.
Fill Color – Select the triangle fill color for NAPL level (or second water level).
Line Weight – Enter line weight in tenths of mm.