Plots of Downhole Point Data are intended to post or chart numeric values or simply post text descriptions at specified depths.
For EQuIS users, data are queried from DT_DOWNHOLE_POINT_DATA.PARAM_VALUE. In the Boring Log Template Design window, the user is presented with the values of DT_DOWNHOLE_POINT_DATA.PARAM to select the data to include in this plot. If downhole chart is created rather than simply a post of the data, the values in the PARAM_VALUE field will be converted to numeric values. In that case, be sure to not have entered any non-numeric data for records containing the PARAM_VALUE to be plotted. If END_DEPTH is specified, then EnviroInsite will draw a box bounded by START_DEPTH and END_DEPTH.
For non-EQuIS users, the data for these plots are derived from the Point Values table. Each record in the Point Values table has a field for numeric values (Value) and text strings (Text Value). If both numeric values and text values are given for a particular record, then EnviroInsite will always use the text string from the Text Value field. To plot the numeric value, leave the Text Value field empty.
Double-click on the desired downhole point data field to add it to the report. Once in the report, double-click the downhole point data object to open the Downhole Point Data dialog box. Modify the tabs as desired.
•Columns with Additional Logic
Click the OK button to save changes.
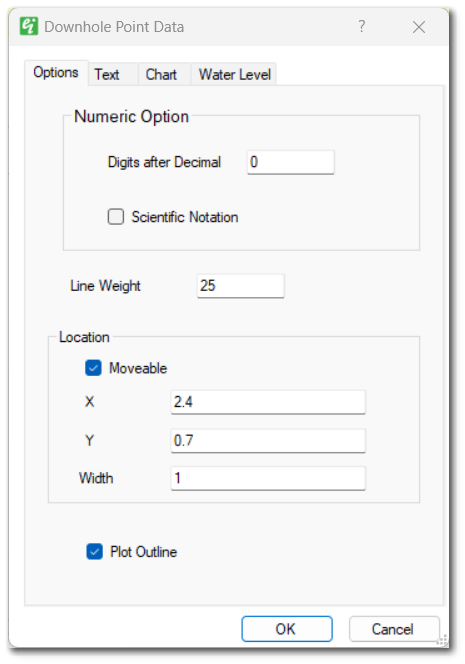
Digits after Decimal – Enter number of digits to appear after decimal point for numeric data.
Scientific Notation – Check to show numeric data using scientific notation.
Line Weight – Enter outline line weight.
Moveable – Check to allow plot to be moved on page with mouse.
Location X and Y – Enter location of plot on the page in inches.
Width – Enter plot width.
Plot Outline – Check to draw outline.
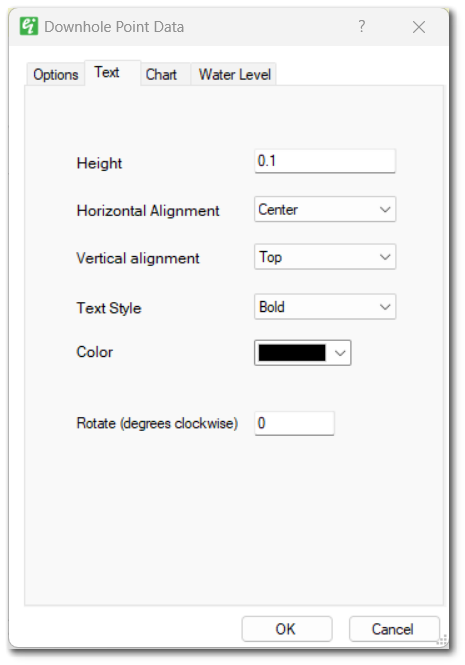
Height – Enter the text height in inches.
Horizontal Alignment – Select the horizontal alignment.
Vertical Alignment – Select the vertical alignment.
Text Style – Select the text style.
Color – Select the text color.
Rotate – Enter value to rotate text.
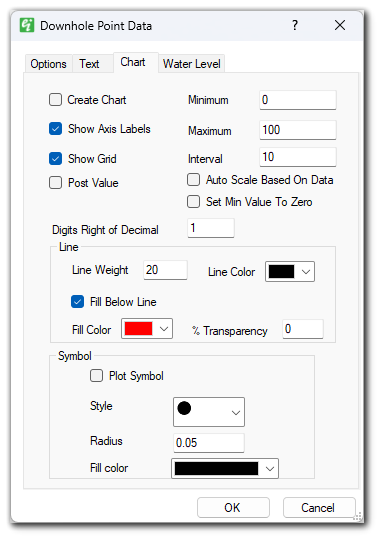
Create Chart – Check to create chart (if not checked, then will post data values).
Show Axis Labels – Check to plot the axis value labels.
Show Grid – Check to create grid.
Post Value – Check to post numeric values next to plotted points.
Minimum – Enter the minimum value for the chart axis.
Maximum – Enter the maximum value for the chart axis.
Interval – Enter the tick interval for the chart axis.
Auto Scale Based On Data – Check to automatically set the scale of the chart axis based on the data being passed.
Set Min Value to Zero – Check to specify that the minimum value for the chart axis starts at zero when the Auto Scale option is enabled.
Digits Right of Decimal – Enter number of digits to appear after decimal point in axis labels.
Line – Select formatting options for chart line.
Symbol – Select formatting options for chart point symbols.
Plot Symbol – Check to plot symbol (otherwise only line is plotted).
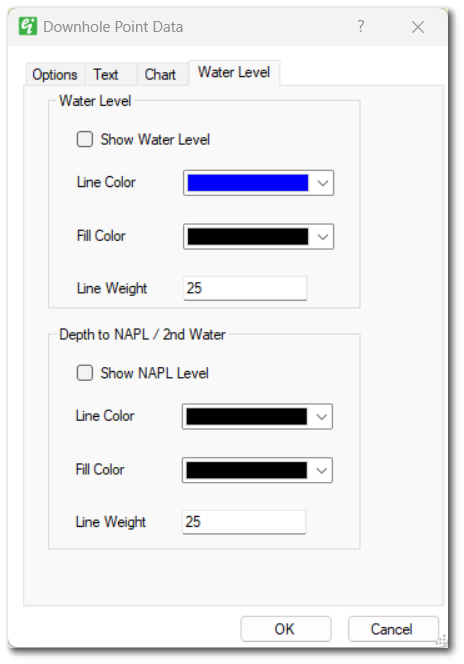
Show Water Level – Check option to display the water level on the axis plot as inverted triangle. The depth water must be stored as a field in the Wells table. The field containing the water level is specified in the Log Plotter options dialog box.
Show NAPL Level – Check option to display the NAPL level (or a second water level) on the axis plot as inverted triangle. The depth to NAPL must be stored as a field in the Wells table (for an EnviroInsite database) or a selection from DT_WATER_TABLE.TYPE (for an EQuIS database). The field containing the depth to NAPL is specified in the Log Plotter Options dialog box.
Data from DT_GEO_RESULT and DT_GEO_TEST are mapped to DT_SAMPLE by DT_GEO_TEST.OBJECT_EUID=DT_SAMPLE.SAMPLE_ID. The data are plotted at depths pulled from DT_GEO_TEST.START_DEPTH if populated, else from DT_SAMPLE.START_DEPTH.
These are calculated fields available to be added as Downhole Point Data to EnviroInsite Boring Logs.
The equation used for the Plasticity Index = Liquid Limit - Plastic Limit. These values are in DT_GEO_RESULT.RESULT_VALUE for the records with these corresponding GEO_RESULT_CODEs:
Liquid Limit = Att_LL
Plastic Limit = Att_PL
If the Plastic Limit ≥ Liquid Limit, then the Plasticity Index is displayed as NP (Nonplastic) and plasticity index is not calculated.
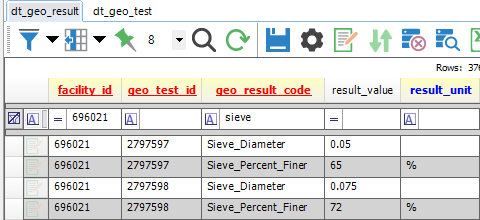
Percent Fines specifications are based on American Society for Testing and Materials (ASTM) standards D4288 and D422 (Material passing the No. 200 sieve [0.075 mm]). For matching GEO_TEST_IDs, the Percent Fines column will plot what is in DT_GEO_RESULT.RESULT_VALUE for record GEO_RESULT_CODE = Sieve_Percent_Finer when the GEO_TEST_ID has a record where DT_GEO_RESULT.RESULT_VALUE = 0.075 mm for GEO_RESULT_CODE = Sieve_Diameter.
Example
In the screenshot below, only 72 would be plotted.
DT_GEO_TEST.TEST_TYPE is available in the Downhole / Point Data section of the Boring Log Template Design window. Only the test types of Unconf_Compression (UC) or UnconsolidateUndrain (UU) will be plotted as those abbreviations listed.