Warning: There are problems with this functionality when running ArcEQuIS in ArcGIS Pro 3.0+. The ArcEQuIS Spider Diagram is currently unavailable and functionality will be addressed in a future release. |
|---|
•Notes about Shapefile-Based Spider Diagrams
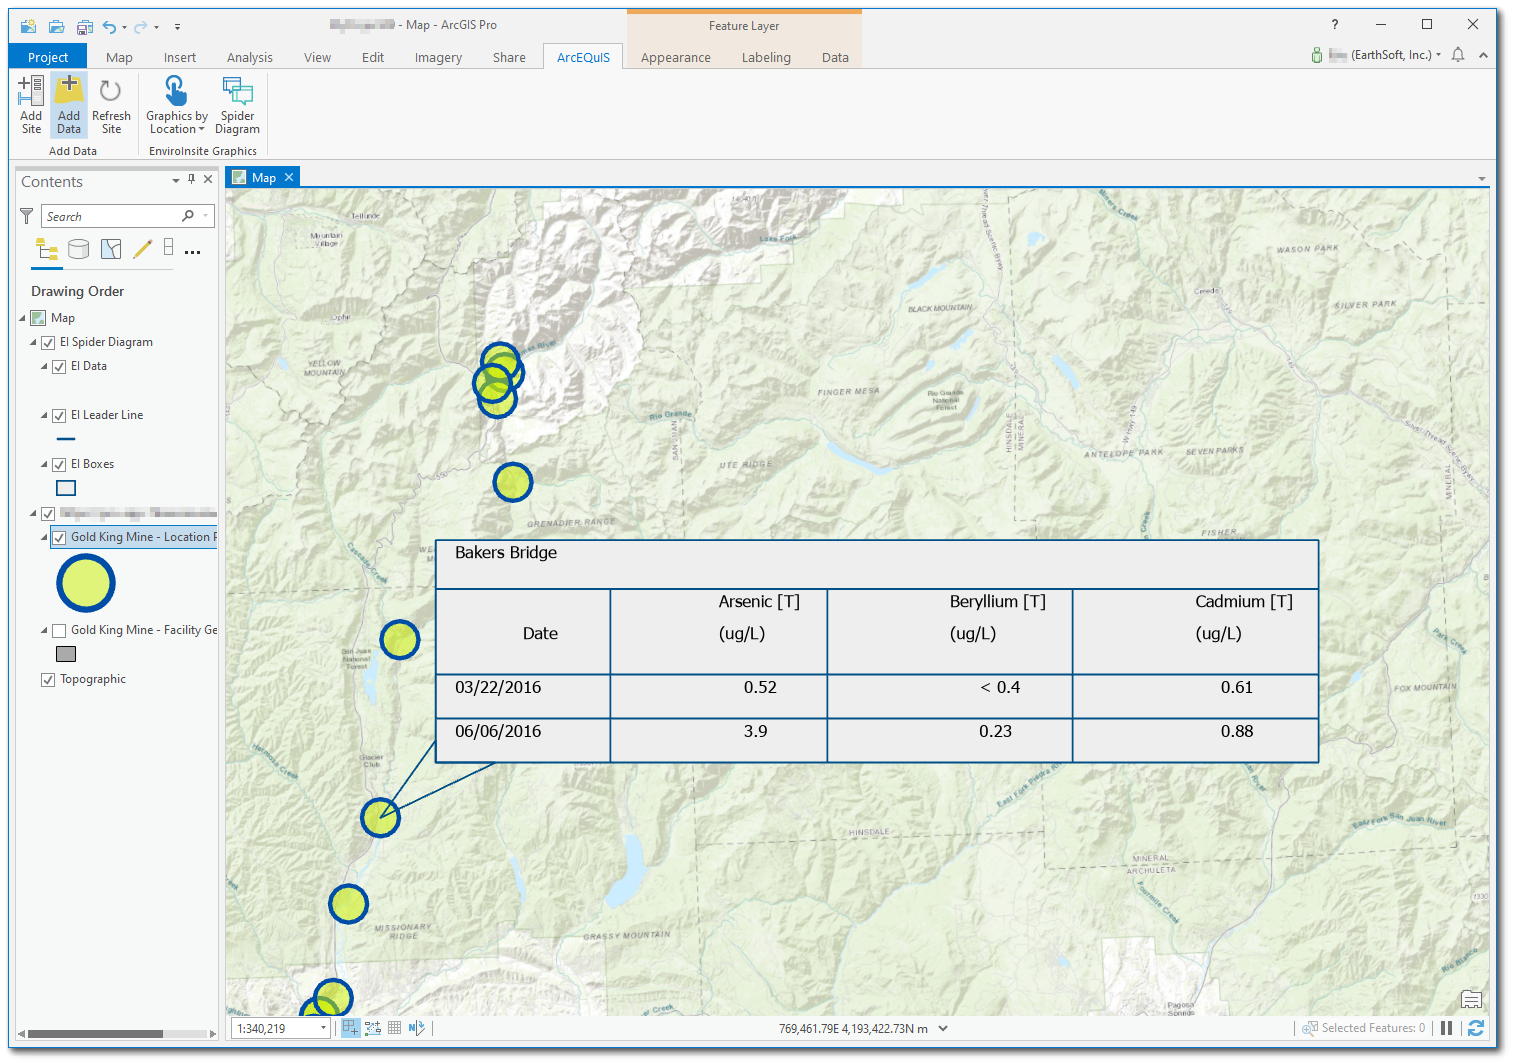
![]() The ArcEQuIS add in for ArcGIS Pro includes the Spider Diagram button, which can be found in the top ribbon of ArcGIS Pro under the ArcEQuIS tab, in the EnviroInsite Graphics section. This button allows users to display tables of analytical data from an EQuIS Database on their maps in ArcGIS Pro.
The ArcEQuIS add in for ArcGIS Pro includes the Spider Diagram button, which can be found in the top ribbon of ArcGIS Pro under the ArcEQuIS tab, in the EnviroInsite Graphics section. This button allows users to display tables of analytical data from an EQuIS Database on their maps in ArcGIS Pro.
Prerequisites
1.Install EnviroInsite (and prerequisites) on your EQuIS Enterprise server as detailed in the EQuIS Enterprise section of the help page here. Note that this will not require an EnviroInsite license. The EnviroInsite_Enterprise_package_x64_{version #}.zip file will be available on the EarthSoft Community Center Downloads Dashboard, regardless of whether or not an EnviroInsite license has been purchased. EarthSoft hosted clients — those with an EQuIS Enterprise site hosted by EarthSoft, generally with an equisonline.com URL — can contact EarthSoft Support to have EnviroInsite installed on their EQuIS Enterprise server.
2.In EQuIS Professional, publish the EnviroInsite Spider Diagram Report (EarthSoft.Reports.Library.EnviroInsite.dll) to the database.
3.In EQuIS Professional or EQuIS Enterprise, create and save a user report from the EnviroInsite Spider Diagram Report to specify the parameter selections used to generate the Spider Diagrams.
Creating a Spider Diagram
Open ArcGIS Pro to a new or existing Map project and connect to an EQuIS Enterprise Site. Add location or other layers using EQuIS Data, if desired.
Add Spider Diagrams as follows:
1.Click the Spider Diagram button (Under the ArcEQuIS Tab):
2.From the EQuIS Graphics Panel that opens, select the EI Spider Diagram tab.
3.In the top drop-down, select EnviroInsite Spider Diagram from the list.
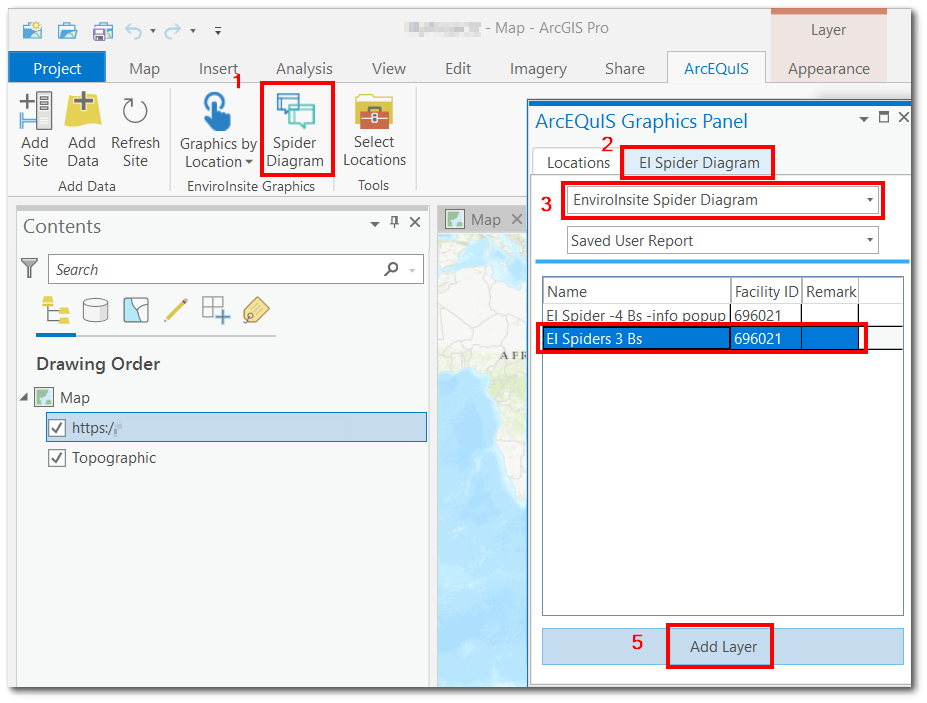
4.Select a Saved User Report from the list that displays below.
5.To add the Spider Diagrams for all locations of the selected User Report input, click Add Layer.
6.(Optional) To add Spider Diagrams only for certain locations (if you have a locations layer added to the map) before Step 4 or 5 above, use the ArcGIS selection tool to select the desired location(s) and then proceed to select the desired User Report and click Add Layer.
The EnviroInsite Spider Diagram shapefiles are saved to the local hard drive at the following default location:
{User}\Documents\ArcGIS\Projects\{projectname}\EQuISDownloads\Spider_{DateTimeDownloaded}.
Notes about Shapefile-Based Spider Diagrams
The EnviroInsite Spider Diagrams are added to the map as a series of three shapefiles:
1.A polygon of the table extent.
2.The leader lines that connect the location point to the chart.
3.A point layer for positioning data within the chart (the points themselves are invisible).
Note several limitations inherent to this structure:
•The chart area and grid lines are a fixed sized (as if they were physical shapes on the ground), but the text and data within the chart are contained in labels which are rendered dynamically based on the scale of the map.
•The chart area and elements are represented by actual coordinates, so they are intended to be displayed at the scale at which they were rendered. They are rendered at the same scale used if “Zoom To Extent” for the facility is selected. If the initial display is inappropriate, the following can help achieve an ideal scale after adding the Spider Diagrams:
•From the Contents > Map, right-click and select Clear Reference Scale to re-enable dynamic scaling.
•Adjust the map zoom level to a scale with optimal spider display.
•From the Contents > Map, right-click and select Set Reference Scale to fix scale at optimal display while zoom/navigation.
•Depending on the coordinate system and projection used, the chart area and grid lines may appear crooked because EnviroInsite renders the shapefiles in UTM, which is then reprojected in ArcGIS Pro, generally to WG84 Web Mercator (Auxiliary Sphere) (the projection of the default base layers). For spider diagrams to appear to have straight lines, choose an appropriate UTM coordinate system for the location of the data. To set the coordinate system, right-click on “Map” in the Contents pane on the left, select Properties, and then select the Coordinate System section.