Form Name: Stiff Diagram
File Name: EarthSoft.Forms.Library.EnviroInsite.dll
Software: EQuIS Professional, EnviroInsite
Source: EnviroInsite install
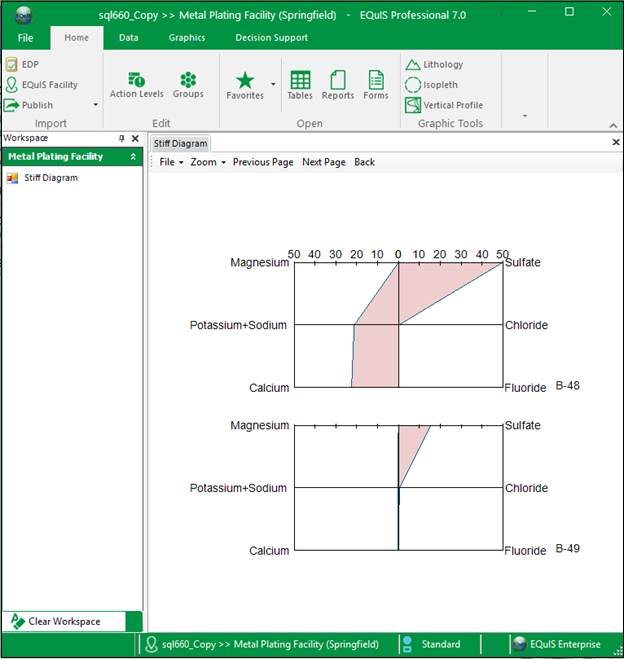
Description: The Stiff Diagram Form produces a conventional Stiff diagram for a set of user-selected anions and cations.
Installation Instructions: The Stiff Diagram form is part of the EarthSoft.Forms.Library.EnviroInsite.dll assembly. This assembly is deployed into the EQuIS Professional installation directory when EnviroInsite is installed (C:\Program Files\EarthSoft\EQuIS\ or (for per-user installation) %localappdata%\Programs\EarthSoft\EQuIS\). For non default installations, this assembly should be copied into the custom EQuIS Professional installation directory.
Instructions:
This form report requires that sample interval depths and elevations be associated with all measured data per instructions in this article.
Input Parameters: The following parameters may be selected from the standard EQuIS parameter selection interface. After the Stiff diagram has been plotted, users may elect to double-click on the resulting diagram to display the Stiff Diagram property dialog box. The property dialog box contains additional properties that are not accessible from the EQuIS Interface. Documentation of the properties in the Stiff Diagram property dialog box are contained in the EnviroInsite documentation.
Parameters |
Description |
Required? |
|---|---|---|
Format |
|
|
Axis Max Value |
Enter the diagram axis max concentration (typically in meg/L). |
YES |
Axis Tick Interval |
Enter the diagram axis tick interval. |
YES |
Text Height |
Enter the diagram text height. |
YES |
Number of Stiff Diagrams |
Enter the number of Stiff diagrams per page. Stiff diagrams in excess are generated on subsequent pages. |
YES |
Anions |
|
|
1 |
Select one or two anions for first row of each Stiff diagram, where anions identified based on negative equivalent weight values. |
YES |
2 |
Select one or two anions for second row of each Stiff diagram. |
YES |
3 |
Select one or two anions for third row of each Stiff diagram. |
YES |
4 |
Select one or two anions for fourth row of each Stiff diagram. |
NO |
Cations |
|
|
1 |
Select one or two cations for first row of each Stiff diagram, where cations identified based on positive equivalent weight values. |
YES |
2 |
Select one or two cations for second row of each Stiff diagram. |
YES |
3 |
Select one or two cations for third row of each Stiff diagram. |
YES |
4 |
Select one or two cations for fourth row of each Stiff diagram. |
NO |
Data |
|
|
Fraction |
Select the fraction value used to filter based on DT_TEST.FRACTION. |
YES |
Matrix |
Select the matrix value used to filter based on DT_SAMPLE.MATRIX. |
YES |
Location |
|
|
Individual(s) |
Enter individual locations to be plotted in the Stiff diagram. |
NO |
Group(s) |
Enter one or more location groups. |
NO |
Sample |
|
|
Type |
Enter sample type. |
NO |
Date Range |
|
|
Start Date |
Enter start date. |
YES |
End Date |
Enter end date, where selection includes samples taken on either sample or end date. |
YES |
Task |
Select one or more sample tasks. |
NO |
Task Code 2(s) |
Select one or more task code 2 values. |
NO |
Field SDG(s) |
Select one or more field SDGs. |
NO |
Test |
|
|
Method(s) |
Enter one or more test methods. |
NO |
Column Number(s) |
Enter one or more test column numbers. |
NO |
Type(s) |
Select one or more test types. |
NO |
Lab Matrix(ces) |
Select one or more test lab matrices. |
NO |
Prep Method(s) |
Select one or more preparation methods. |
NO |
Lab SDG(s) |
Select one or more lab SDGs. |
NO |
Result |
|
|
Type(s) |
Select one or more result types. |
NO |
Non-Detect Multipliers |
Enter the non-detect multiplier to be used in designation of values for flagged non-detect results. |
YES |
Reportable |
Select reportable values. |
NO |
Validated |
Select one or more validated values. |
NO |
Data Requirements: Concentrations of cations and anions are converted from mass-based to equivalent-based values using entered values of equivalent weight in populated RT_ANALYTE_DETAIL.EQUIVALENT_WEIGHT fields. Only analytes for which RT_ANALYTE_DETAIL.EQUIVALENT_WEIGHT has been populated will be available for selection within the report. EnviroInsite expects that the equivalent weight of anions will be entered as negative quantities, while cations will carry positive equivalent weight values.
Example Output: View the following example or contact EarthSoft Support.