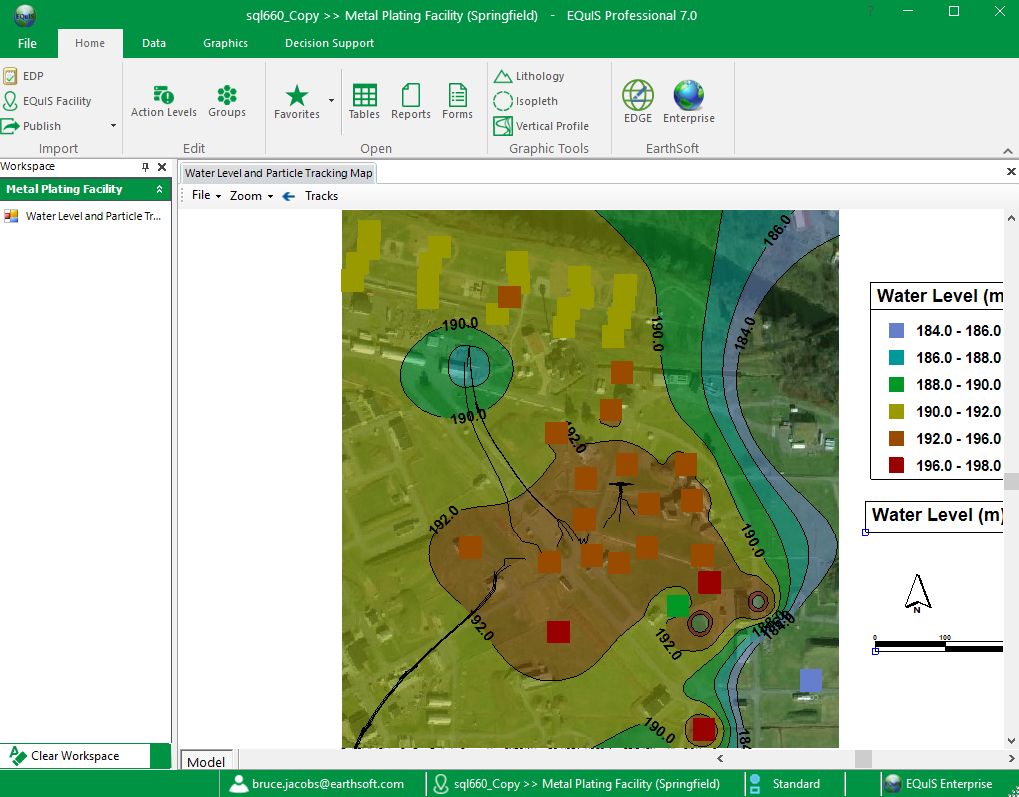
Form Name: Water Level and Particle Tracking Map
File Name: EarthSoft.Forms.Library.EnviroInsite.dll
Software: EQuIS Professional, EnviroInsite
Source: EnviroInsite install
Description: The Water Level and Particle Tracking Map Form generates a map featuring the elements outlined below.
Installation Instructions: The Water Level and Particle Tracking Map form is part of the EarthSoft.Forms.Library.EnviroInsite.dll assembly. This assembly is deployed into the EQuIS Professional installation directory when EnviroInsite is installed (C:\Program Files\EarthSoft\EQuIS\ or (for per-user installation) %localappdata%\Programs\EarthSoft\EQuIS\). For non default installations, this assembly should be copied into the custom EQuIS Professional installation directory.
Instructions:
1.Basemap – For no map display, specify 'None'. Three basemap styles are available, drawn from online map or photo image sources. Visit linked sites for details.
•Bing Maps (Aerial Photo)
•Imagery (ArcGIS Aerial Photo)
•Street Map (ArcGIS Map)
•Topographic (ArcGIS Topo)
The base map boundaries (minimum and maximum northing and easting values) are initialized using the values of DT_FACILITY.X_MIN, DT_FACILITY.X_MAX, DT_FACILITY.Y_MIN, and DT_FACILITY.Y_MAX. If these DT_FACILITY fields are not populated, then the values are based on DT_COORDINATE.X_COORD and DT_COORDINATE.Y_COORD. If the values are in a latitude-longitude coordinate system, they will be converted to the display coordinate system.
Note the horizontal extent for the data query is not accessible from the Form parameter menu.
2.Posted Values – Measured water levels are posted within boxes connected by a leader to the sample locations.
3.Symbol Plots – Measured water levels are represented using symbols that are color-coded to indicate the concentration at the symbol location.
4.Contours – Contours of measured water levels are drawn based on values interpolated from measured values onto points on a rectangular grid. These contours may be either simple lines or with fill between the drawn lines.
This form report requires that sample interval depths and elevations be associated with all measured data per instructions in this article.
The location of individual components such as north arrow, map scale, legends, and posted values may be modified by dragging the items within the map interface and dropping them in their new locations.
Once the form has been generated with the mapped content, users may select Tracks from the Form menu. This presents them with the opportunity of clicking points that describe a polyline on which track start points will be distributed. On completion of the polyline definition, users should click the right button, at which point the tracks will be generated.
Maps are plotted in UTM coordinates. EnviroInsite determines the coordinate system to be used based on the value in the EQuIS data field RT_COORD_TYPE.SRID. An SRID value of 4326 indicates that the coordinate values are in latitude-longitude coordinates. In that case, the display coordinates will be in UTM, within the UTM zone at the center of the extent of the location positions. SRID values starting with 326 are presumed to indicate UTM coordinates within the northern hemisphere. SRID values starting with 327 are presumed to indicate UTM coordinates within the southern hemisphere. The final two digits in either of these cases are taken to be the UTM longitudinal zone. State plane coordinates are not supported at this time.
File Name: EarthSoft.Forms.Library.EnviroInsite.dll
Language: English
Input Parameters: The following parameters may be selected from the standard EQuIS parameter selection interface. After the map has been generated, users may elect to double-click on individual components to bring up dialog boxes that allow for greater control of the plot contents than from the EQuIS report interface. Readers may find it useful to refer to the EnviroInsite documentation for a complete description of the generated object properties.
Parameters |
Description |
Required? |
|---|---|---|
Contour Data? |
Check to generate contours of the selected water levels. |
YES |
Plot Symbols? |
Check to plot symbols that are color-coded based on the selected water levels. |
YES |
Post Values? |
Check to post the water levels at the measured locations. |
NO |
Base-Map |
||
Map Source and Style |
Select from an aerial photo, map or topographic map from ArcGIS Online aerial photo. Select 'None' to not plot a base map. |
NO |
Minimum Easting |
Enter the minimum easting value of the generated base map in UTM coordinates. |
YES, unless 'None' selected for Map Source and Style |
Maximum Easting |
Enter the maximum easting value of the generated base map in UTM coordinates |
YES, unless 'None' selected for Map Source and Style |
Minimum Northing |
Enter the minimum northing value of the generated base map in UTM coordinates. |
YES, unless 'None' selected for Map Source and Style |
Maximum Northing |
Enter the minimum northing value of the generated base map in UTM coordinates. |
YES, unless 'None' selected for Map Source and Style |
Particle Tracking |
||
Hydraulic Conductivity |
Enter the hydraulic conductivity in dimensions of length per time. The temporal unit for the hydraulic conductivity, and the calculation time step should be the same. |
YES, to enable the particle tracking feature |
Effective Porosity |
Enter the effective porosity in fractional units. |
YES, to enable the particle tracking feature |
Duration |
Enter the total duration of the particle tracking calculation. |
YES, to enable the particle tracking feature |
Calculation Time Step |
Enter the time interval over which particles are advected, prior to a recalculation of their local velocity. |
YES,to enable the particle tracking feature |
Arrow Steps |
Enter the number of calculation time steps between the posting of an arrow on a particle track. |
YES, to enable the particle tracking feature |
Arrow Width |
Enter the arrow width in map units. |
YES, to enable the particle tracking feature |
Arrow Length |
Enter the arrow length in map units. |
YES, to enable the particle tracking feature |
Data |
||
Aggregate Function |
Select method to aggregate multiple water levels at single location from mean, minimum, maximum, first or last. |
YES |
Format |
||
Interval Values |
Enter the contour and symbol interval values as comma-delimited list. |
YES, if either Contour Data or Plot Symbols is selected |
Digits after Decimal |
Enter the number of digits after the decimal used in posted values and in legends of contour and symbol plots. |
YES, if either Contour Data or Plot Symbols is selected |
Text Height |
Enter the text height in map units. |
YES, if either Contour Data or Plot Symbols is selected |
Symbol Radius |
Enter the symbol radius in map units. |
YES, if either Contour Data or Plot Symbols is selected |
Contour |
||
Style |
Select from either line or fill contour styles. |
YES, if Contour Data selected |
Interpolation Method |
Select interpolation method used to estimate values on rectangular grid in process of generating contours. |
YES, if Contour Data selected |
Kriging range value in |
Set the kriging range value used to specify horizontal persistence in east-west direction. |
YES, if Contour Data selected |
Kriging range value in |
Set the kriging range value used to specify horizontal persistence in north-south direction. |
YES, if Contour Data selected |
Log Transform |
Place check to carry out contour generating using log-transform of analyte concentrations. Useful for instances where concentration variation over multiple orders of magnitude. |
|
Percent Transparency |
Enter percent transparency for fill contours. |
YES, if Contour Data selected |
Minimum Easting |
Enter the minimum easting value of the rectangular grid on which the contours are plotted. |
YES, if Contour Data selected |
Maximum Easting |
Enter the maximum easting value of the rectangular grid on which the contours are plotted. |
YES, if Contour Data selected |
Minimum Northing |
Enter the minimum northing value of the rectangular grid on which the contours are plotted. |
YES, if Contour Data selected |
Maximum Northing |
Enter the maximum northing value of the rectangular grid on which the contours are plotted. |
YES, if Contour Data selected |
# of Grid Rows |
Enter the number of rectangular grid rows. |
YES, if Contour Data selected |
# of Grid Columns |
Enter the number of rectangular grid columns. |
YES, if Contour Data selected |
Label Density |
Enter the label density, where reduced densities result in fewer labels being placed. |
YES, if Contour Data selected |
Skip Interval |
Enter the skip interval that controls the contour intervals for which labels are generated. A value of one results in all contour lines being generated. A value of two results in every other contour line being labeled. |
YES, if Contour Data selected |
Location |
||
Individual(s) |
Enter individual locations to be plotted. |
NO |
Group(s) |
Enter one or more location groups. |
NO |
Water Level |
||
Date Range |
||
Start |
Enter start date. |
YES |
End |
Enter end date, where selection includes measurements taken on either sample or end date. |
YES |
Task |
Select one or more sample tasks. |
NO |
Reported Value |
Choose to calculate the elevation, or to use either DT_WATER_LEVEL.CORRECTED_ELEVATION or DT_WATER_LEVEL.WATER_LEVEL_ELEV to represent the water level. |
YES |
Calculation |
||
Elevation |
Select field to be used for the reference elevation in calculation of water level from: DT_WATER_LEVEL.HISTORICAL_REFERENCE_ELEV, DT_MEASURE_DATUM.DATUM_VALUE, VW_LOCATION.SURF_ELEV, and DT_WELL.TOP_CASING_ELEV
|
YES, if calculation option selected for Reported Value |
Depth |
Choose how water depth is to be determined from calculate based on product density, DT_WATER_LEVEL.CORRECTED_DEPTH, DT_WATER_LEVEL.WATER_LEVEL_DEPTH |
YES, if calculation option selected for Reported Value |
Reportable |
Select to filter results based on value in DT_WATER_LEVEL.REPORTABLE_YN field. |
NO |
Tables:
Database Schema: Standard (no custom or add on EQuIS Schemas required)
Database Version: EQuIS 7
Database Requirements: Water levels must be recorded within DT_WATER_LEVEL. Report uses same options as water_level function in EQuIS Database.
Report Requirements: A local installation of EQuIS EnviroInsite and a Graphics Library or EnviroInsite Decision Support license are required to run this export within EQuIS Professional.
Output Type: Windows supported print drivers
Example Output: View the following example or contact EarthSoft Support.