Form Name: Piper Diagram
File Name: EarthSoft.Forms.Library.EnviroInsite.dll
Software: EQuIS Professional, EnviroInsite
Source: EnviroInsite install
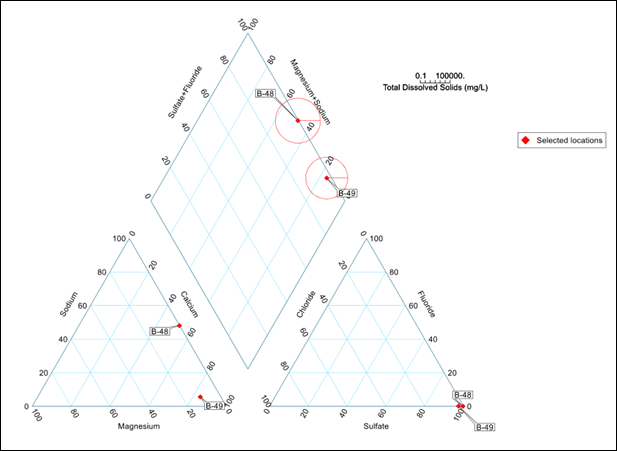
Description: The Piper Diagram Form produces a conventional Piper diagram for a set of user-selected anions and cations. Users may elect to plot labels indicating the sample location ID. They may also elect to represent an additional analyte (typically total dissolved solids) as circles in the upper quadrant of the diagram, where the radius of each circle is proportional to the log-scale of the selected analyte. Once plotted, label positions may be manually modified.
Installation Instructions: The Piper Diagram form is part of the EarthSoft.Forms.Library.EnviroInsite.dll assembly. This assembly is deployed into the EQuIS Professional installation directory when EnviroInsite is installed (C:\Program Files\EarthSoft\EQuIS\ or (for per-user installation) %localappdata%\Programs\EarthSoft\EQuIS\). For non default installations, this assembly should be copied into the custom EQuIS Professional installation directory.
Instructions:
This form report requires that sample interval depths and elevations be associated with all measured data per instructions in this article.
Input Parameters: The following parameters may be selected from the standard EQuIS parameter selection interface. After the Piper diagram has been plotted, users may elect to double-click on the resulting diagram to display the Piper Diagram property dialog box. The property dialog box contains additional properties that are not accessible from the EQuIS Interface. Documentation of the properties in the Piper Diagram property dialog box are contained in the EnviroInsite documentation.
Parameters |
Description |
Required? |
|---|---|---|
Plot Label? |
Check to plot a label next to each measured value. |
NO |
Legend |
||
Plot Legend |
Check to create a legend for the plotted points. |
NO |
Legend Title |
Enter text string describing the plotted points. |
NO |
Symbol |
||
Style |
Select the symbol style. |
YES |
Color |
Select the symbol color. |
YES |
Height |
Select the symbol height. |
YES |
Anions |
||
Bottom Axis |
Select the one or two anions to be plotted on the bottom axis, where anions identified based on negative equivalent weight values. |
YES |
Left Axis |
Select the one or two anions to be plotted on the left axis. |
YES |
Right Axis |
Select the one or two anions to be plotted on the right axis. |
YES |
Cations |
||
Bottom Axis |
Select the one or two cations to be plotted on the bottom axis, where cations identified based on positive equivalent weight values. |
YES |
Left Axis |
Select the one or two cations to be plotted on the left axis. |
YES |
Right Axis |
Select the one or two cations to be plotted on the right axis. |
YES |
Data |
||
Fraction |
Select the fraction value used to filter based on DT_TEST.FRACTION. |
YES |
Display Fraction |
Enable this option to display the fraction beside the chemical name in the output. |
NO |
Matrix |
Select the matrix value used to filter based on DT_SAMPLE.MATRIX. |
YES |
TDS |
||
Total Dissolved Solid |
Select the analyte to be used in plotting of scaled circles typically used in Piper diagrams for conveying the concentration of total dissolved solids. |
NO |
Scale Max. Value |
Enter the maximum value to be presented on the TDS scale bar. |
YES, if total dissolved solid value entered |
Display Scale |
Enter the length of the scale to be used to represent the entered Scale Max Value. |
YES, if total dissolved solid value entered |
Location |
||
Individual(s) |
Enter individual locations to be plotted in the Piper diagram. |
NO |
Group(s) |
Enter one or more location groups. |
NO |
Sample |
||
Type |
Enter sample type. |
NO |
Date Range |
||
Start Date |
Enter start date. |
YES |
End Date |
Enter end date, where selection includes samples taken on either sample or end date. |
YES |
Task |
Select one or more sample tasks. |
NO |
Task Code 2(s) |
Select one or more task code 2 values. |
NO |
Field SDG(s) |
Select one or more field SDG values. |
NO |
Test |
||
Method(s) |
Enter one or more test methods. |
NO |
Column Number(s) |
Enter one or more test column numbers. |
NO |
Type(s) |
Select one or more test types. |
NO |
Lab Matrix(ces) |
Select one or more test lab matrices. |
NO |
Prep Method(s) |
Select one or more preparation methods. |
NO |
Lab SDG(s) |
Select one or more lab SDG(s). |
NO |
Result |
||
Type(s) |
Select one or more result types. |
NO |
Non-Detect Multiplier |
Enter the non-detect multiplier to be used in designation of values for flagged non-detect results. |
YES |
Reportable |
Select reportable values. |
NO |
Validated |
Select one or more validated values. |
NO |
Data Requirements: Concentrations of cations and anions are converted from mass to milliequivalents (meq) based on the entered values of equivalent weight in populated RT_ANALYTE_DETAIL.EQUIVALENT_WEIGHT fields. Only analytes for which RT_ANALYTE_DETAIL.EQUIVALENT_WEIGHT has been populated will be available for selection within the report. EnviroInsite expects that the equivalent weight of anions will be entered as negative quantities, while cations will carry positive equivalent weight values.
Report Requirements: A local installation of EQuIS EnviroInsite 7 is required to run this export. If the form is grayed out, make sure to select the EnviroInsite license under the Decision Support license chooser.
Example Output: View the following example or contact EarthSoft Support.
Notes: •Our developers are working on adding a helpful message when data is missing from the dataset, rather than producing an empty output. However, to avoid receiving a blank Piper Diagram in the output, be sure the following data requirements exist: oAt least six analytes (three cations and three anions) that contain data from the same sample are chosen. It is often helpful to first run the Analytical Results II Report for the selected analytes to check. oDT_RESULT.RESULT_UNIT cannot be null for any of the selected analytes. oDT_TEST.FRACTION should match across the selected analytes, and this FRACTION should be selected as a parameter. •If the same ion has Total (T), Dissolved (D), and Not applicable (N) Fractions within a location, the output (D) or (T) or (N) will be displayed in the order of priority.
Warning: The selections in the EnviroInsite query do not get reset after running the report. For example, if Bicarbonate is selected in the parameters and the report returns a blank output because Bicarbonate does not have data, and then Bicarbonate is removed from the report parameter selection and rerun, the report output will still be blank. The workaround for this issue is to clear the workspace before rerunning the report/form. This has been escalated for resolution in a future build. |