The Drilldown Widget displays the output of a grid report (i.e., IGridReport) as a category chart: pie chart, bar chart (horizontal bars), or column chart (vertical columns). Optionally (if configured), the chart allows the user to drilldown into the data by clicking on the desired category/series (the horizontal bar, the vertical column, or the pie segment).
Note: 1.There is a 1000 row limit to the Drilldown widget. A report that contains greater than 1000 rows will not function in the Drilldown widget and will display the message "No Data to Display". If you receive this message, restrict the report parameters to include fewer data points. 2.When multiple Drilldown widgets exist on the same dashboard, drilldown may not work in all of the widgets. |
|---|
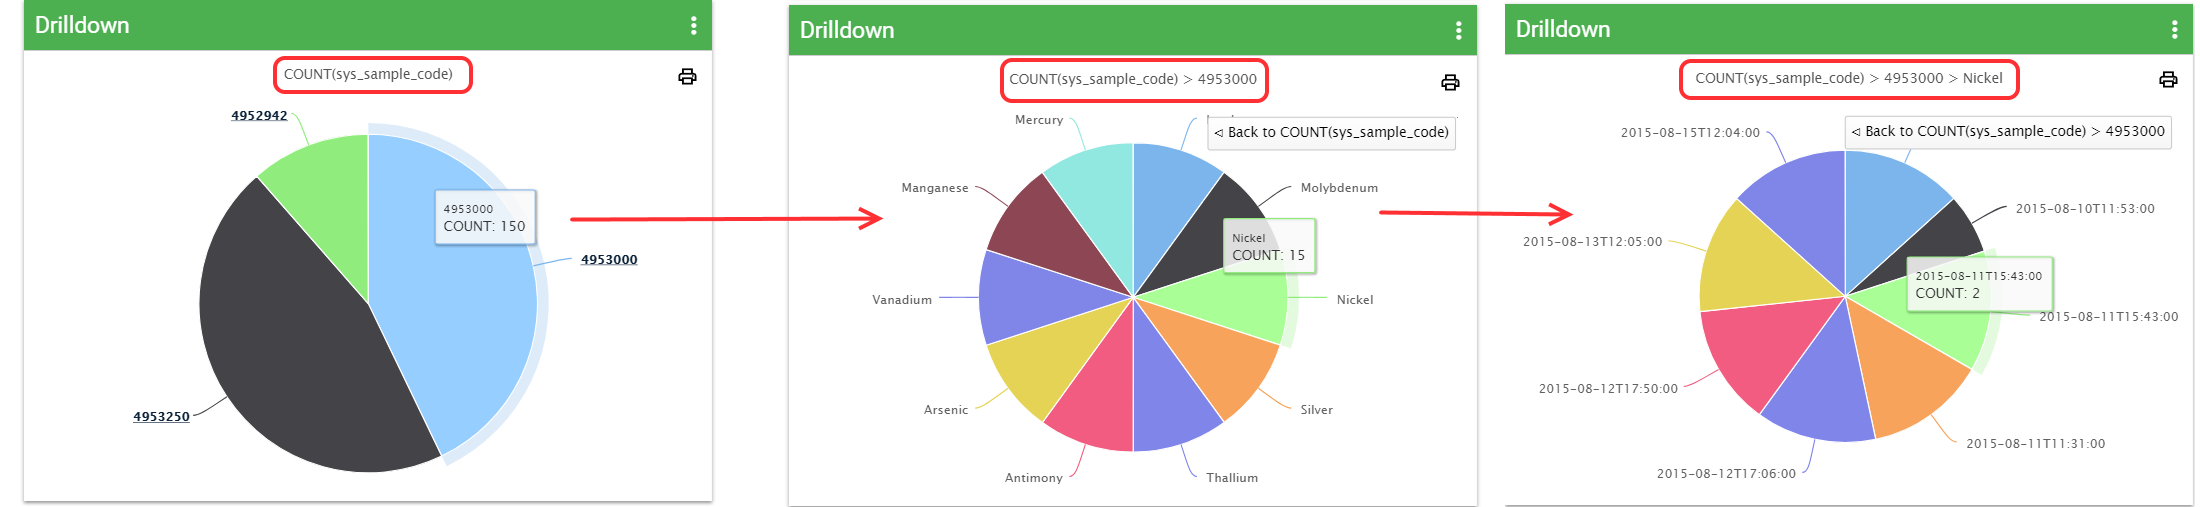
Print Chart – The option to print the chart, as seen in the widget, can be accomplished by clicking the Print ![]() button in the top-right corner of the chart.
button in the top-right corner of the chart.
Title – The title of the chart will automatically show the aggregate operator and the field being aggregated (e.g., "SUM(REPORT_RESULT_VALUE"). If desired, the title can be manually set in the Advanced tab of the widget properties.
Tooltip – Hovering the mouse over the chart will display a tooltip. The top line of the tooltip contains the series/category name. The second line shows the aggregate (e.g., "SUM") and the aggregated value. If a unit column is selected, the tooltip will also display the unit.
Widget Properties
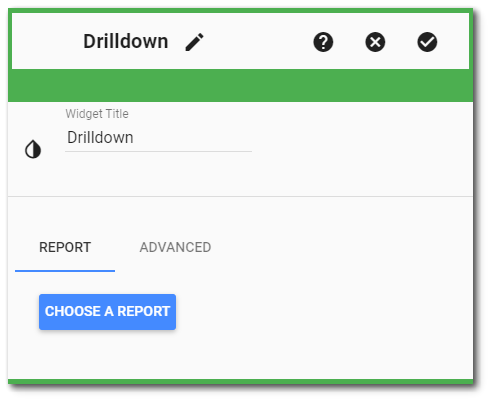
The Drilldown widget is empty when added to a dashboard and must be configured to show report results. The editor for this widget allows the user to select a report, and then use the columns from the report to configure the widget appearance. To add a report or edit other widget properties, open the Widget Editor by selecting the More Options ![]() icon in the upper right corner of the widget to display the drop-down menu and then select the Edit menu option. The Widget Editor includes two tabs used to define what and how the widget contents are displayed: Report and Advanced.
icon in the upper right corner of the widget to display the drop-down menu and then select the Edit menu option. The Widget Editor includes two tabs used to define what and how the widget contents are displayed: Report and Advanced.
Widget Title – By default, the widget title is Drilldown. The title can be modified.
Widget Description – The description field provides a caption of the widget content for screen readers. This field improves accessibility by allowing visual elements such as charts to be given accessible text descriptions. It also displays a tooltip when hovering on the widget header. Default text (of the widget type's description) is provided but can be edited by users for additional context. This field has a 250-character limit.
Widget Color – The color of the widget can be changed using the Widget Theme![]() icon to the left of the widget title.
icon to the left of the widget title.
Widget Object Editor – To set various appearance properties of the widget, select the Object Editor ![]() icon in the widget header to open the Widget Object Editor. See the Widget Editor article for more details.
icon in the widget header to open the Widget Object Editor. See the Widget Editor article for more details.
Help – The Help ![]() icon connects to the online documentation related to the specific widget.
icon connects to the online documentation related to the specific widget.
Copy Settings – Select the Copy Settings ![]() icon to to copy the settings from another widget of the same type. See the Copy Widget Settings article for more information.
icon to to copy the settings from another widget of the same type. See the Copy Widget Settings article for more information.
Cancel – Select the Close without Saving ![]() icon to exit the Widget Editor without saving changes.
icon to exit the Widget Editor without saving changes.
Save – Changes will be applied to the widget by clicking on the Save ![]() icon. The Widget Editor screen will close after the save operation is complete.
icon. The Widget Editor screen will close after the save operation is complete.
Reports Tab
Report Chooser – This control is used to select the report to be used with this instance of the Drilldown widget. The name of the currently selected report (if applicable) is displayed by default. To select a different report, click the Choose a Report button or name of the report. The Report Chooser will open and display available reports. Select the desired report.
Note: Because the report output is displayed as rows of data in a grid, you must choose a report that produces a table of data (i.e., an IGridReport). |
Report Parameters – The report parameters (e.g., facility, sample date range, etc.) can be edited by clicking on the Edit button ![]() to open the Report Parameter Editor for the selected report. A user with editor permission on the selected report may update the report.
to open the Report Parameter Editor for the selected report. A user with editor permission on the selected report may update the report.
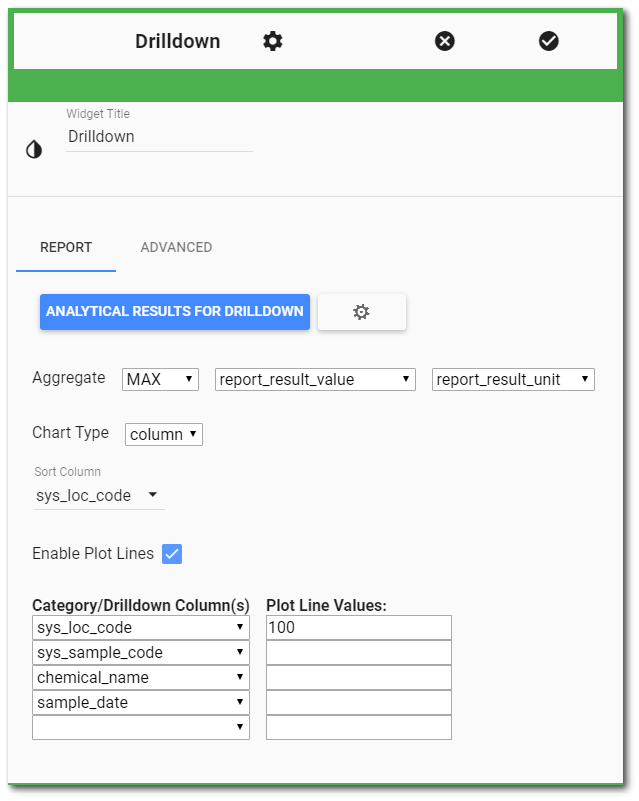
After choosing a valid grid report, the Drilldown widget will run the report and display the output columns for the report in a simple table. Use the table of columns to configure the chart displayed by the widget. To unset a column parameter, select the "blank" option from the drop-down menu.
Aggregate – Use the three drop-down menus to select the desired parameters.
•The first drop-down allows the user to select the desired aggregate operator (e.g., COUNT). An operator must be selected.
•The second drop-down allows the user to select the value field from the report (e.g., SYS_SAMPLE_CODE) to which the aggregate operator will be applied. A value field must be selected.
•The third drop-down allows the user to select the unit field (from the report) that contains the unit of the selected value field. Only fields whose name ends with "_UNIT" will be displayed. Selecting a unit field is optional.
Chart Type – Use the drop-down menu to select the desired chart type.
•Bar – A bar chart that displays the aggregated values as horizontal bars.
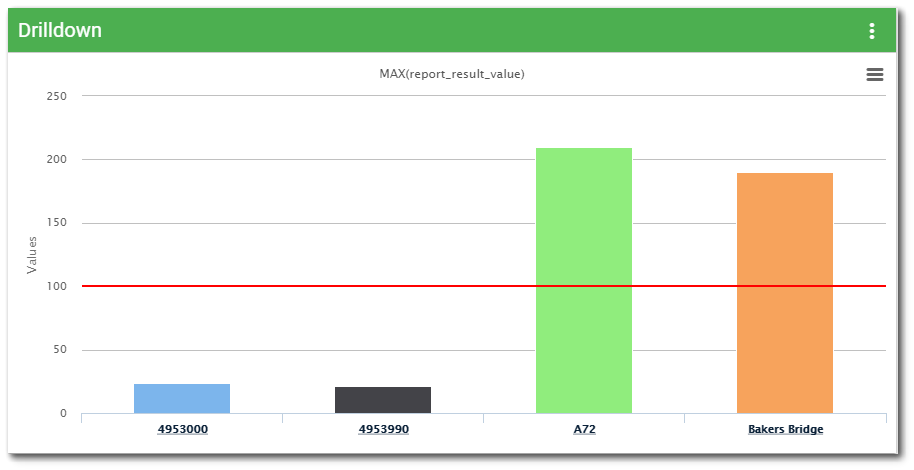
•Column – A column chart that displays the aggregated values as vertical columns.
•Pie – A pie chart that displays the aggregated values as segments of a circle.
Sort Column – The drop-down menu lists the fields from the report that may be selected to sort that field alphabetically in the widget. Only the drilldown level with the same column name as the Sort Column get ordered alphabetically. For example, setting the Sort Column to CHEMICAL_NAME orders the CHEMICAL_NAME level of the drilldown alphabetically. When the Sort Column is blank, the Drilldown widget uses the default sort from the report output (i.e., SAMPLE_DATE).
Category/Drilldown Column(s) – These drop-down menus list the fields from the report that may be selected as the category column(s). The unique values in the selected column(s) will become the series on the chart. For example, if CHEMICAL_NAME is selected, then each unique chemical name in the report output will be its own series. The first (top) column drop-down must be selected. If the remaining drop-downs are left blank, then the chart will not have drilldown functionality. If a column is selected in subsequent drop-downs, then the chart will drilldown based on the selected column(s). For example, SYS_LOC_CODE is selected as the first field and CHEMICAL_NAME is selected as the second column. The chart would then show unique SYS_LOC_CODE values at the top-level, allowing drilldown to show unique CHEMICAL_NAME values for each SYS_LOC_CODE.
Enable Plot Lines – This option allows the user to specify an action level or other value of interest to plot on the Drilldown widget when the selected Chart Type is either bar or column. When "Enable Plot Lines" is checked, plot line boxes next to the Category/Drilldown columns are available to assign values. The two grids are aligned to indicate that setting a plot line in the first/top box will be displayed for the first Drilldown column. Non-numeric values (i.e., text) assigned a plot line are ignored. If the Chart Type is a pie chart, the boxes are disabled and no lines will be displayed in the chart.
Advanced Tab
The Advanced tab shows the JavaScript Object Notation (JSON) representation of the chart options that will be used to display the chart. Expert users may edit the JSON text directly to modify advanced properties of the chart (see the Highcharts website for more information: http://www.highcharts.com/docs).
Note: In a bar chart, setting a label rotation value greater than 74 may result in labels becoming illegible. |
|---|