Contouring, charts, and symbol plots are great ways to convey a lot of information, but sometimes a careful look at the individual measurements is necessary. Generating data table plots enables the analysis of individual measurements and the sequence of measurements that may enable a deeper understanding of the measured data.
Georeferenced data table plots are posted on the map at the associated locations. The tables can quickly fill up the screen. Judicious selection of parameters, time ranges, and well names may help reduce the potential clutter. Reducing the text size will also reduce the size of the data table. The posted data tables can be dragged with the mouse to eliminate overlapping tables.
View a recorded webinar on the creation of data tables in EnviroInsite here.
Click Plot> 2D Data from the main menu and select Table. The Data Table dialog box opens. Modify the table properties on the Query tab, Options tab, Text tab, Format tab, Standard tab, and EQuIS Query tab as desired. Click the OK button to save changes.
Modifications to the number formatting, including a thousand separator, can be made via the Edit > Localization from the main menu. This will open the Localization dialog box where these properties can be set.
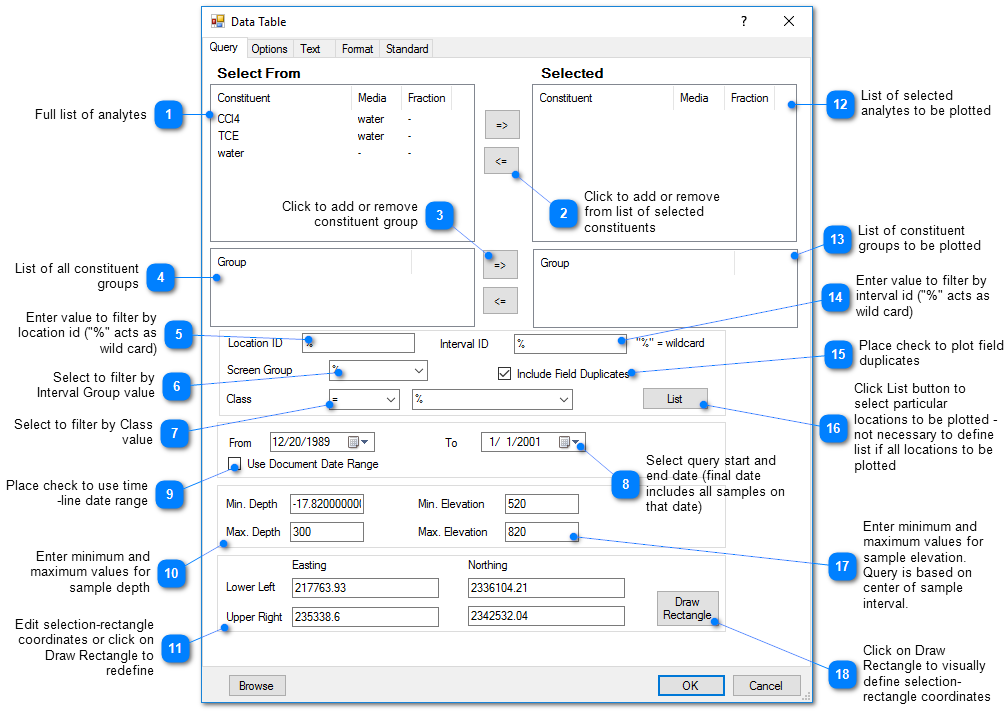
Query Tab
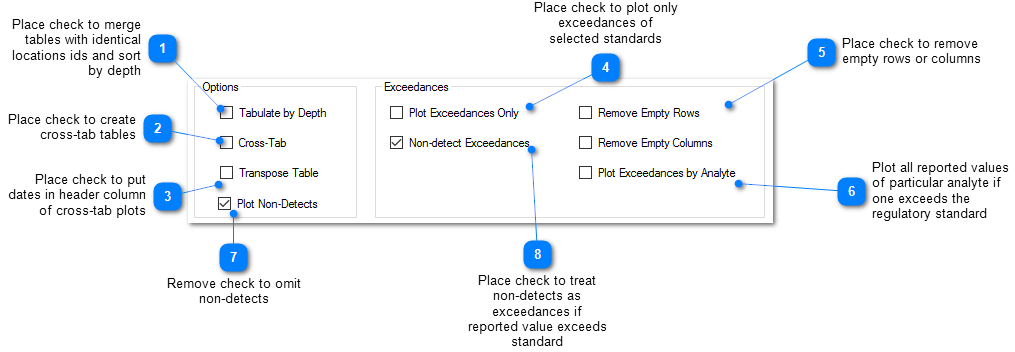
Options Tab
Select the desired options from the various sections on the Options tab.
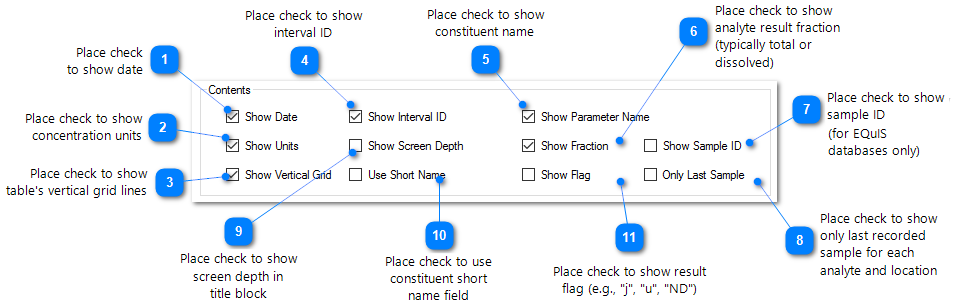
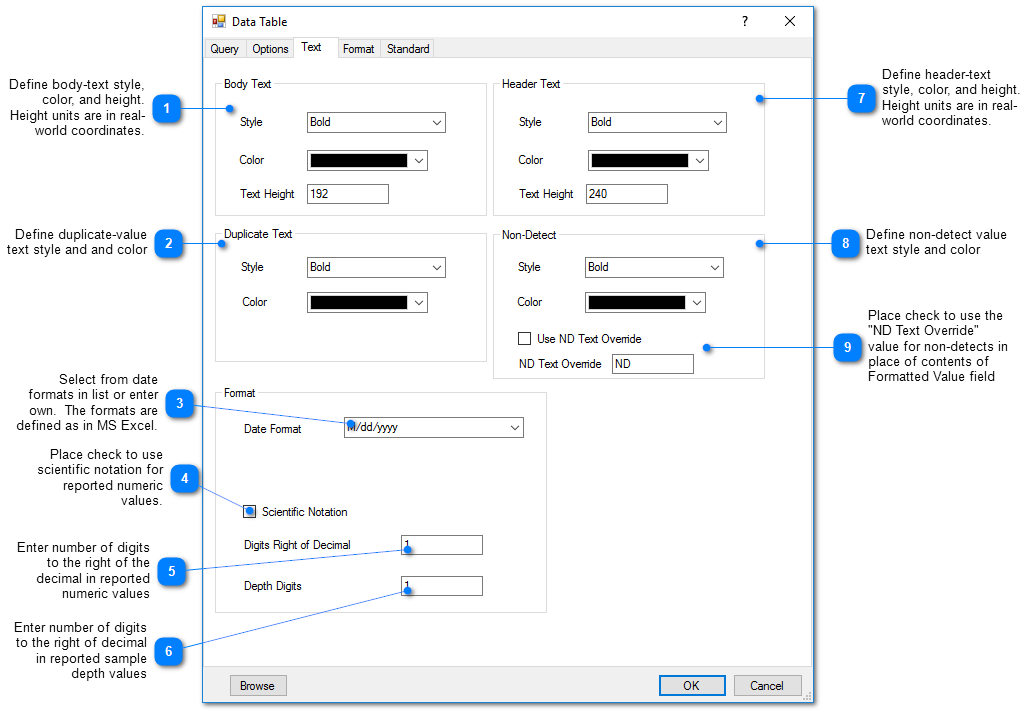
Text Tab
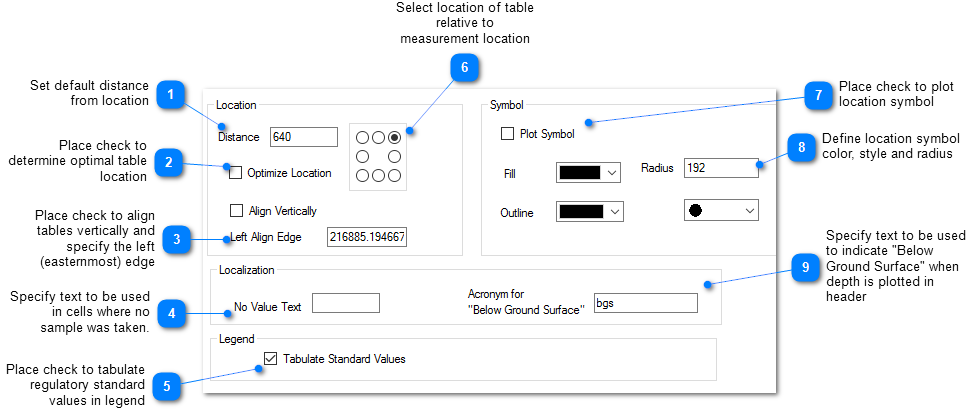
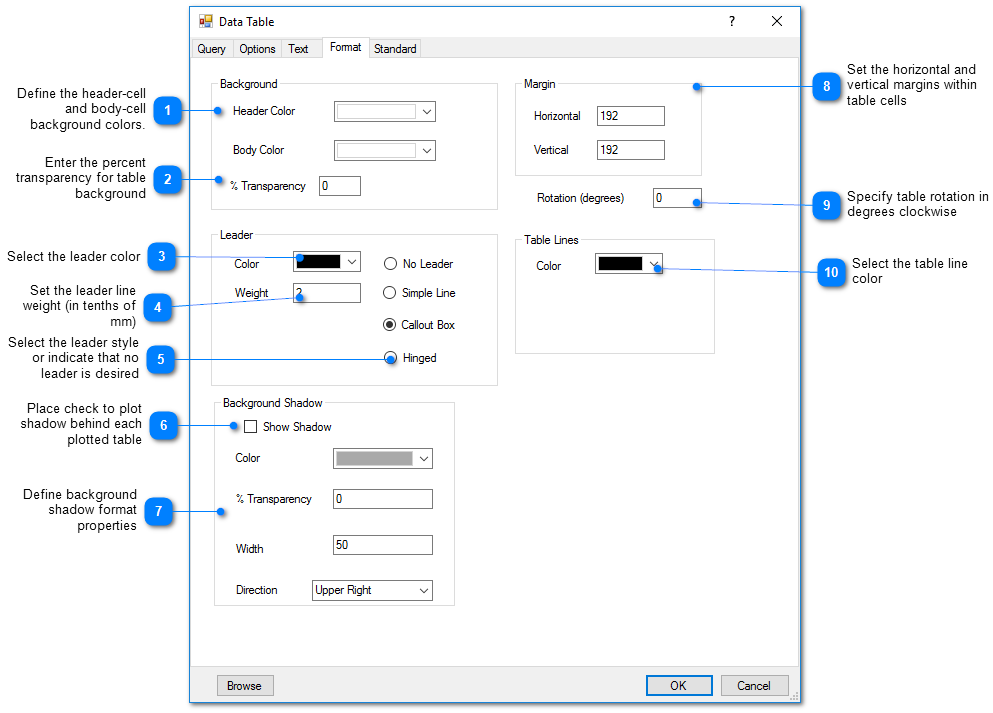
Format Tab
Standard Tab
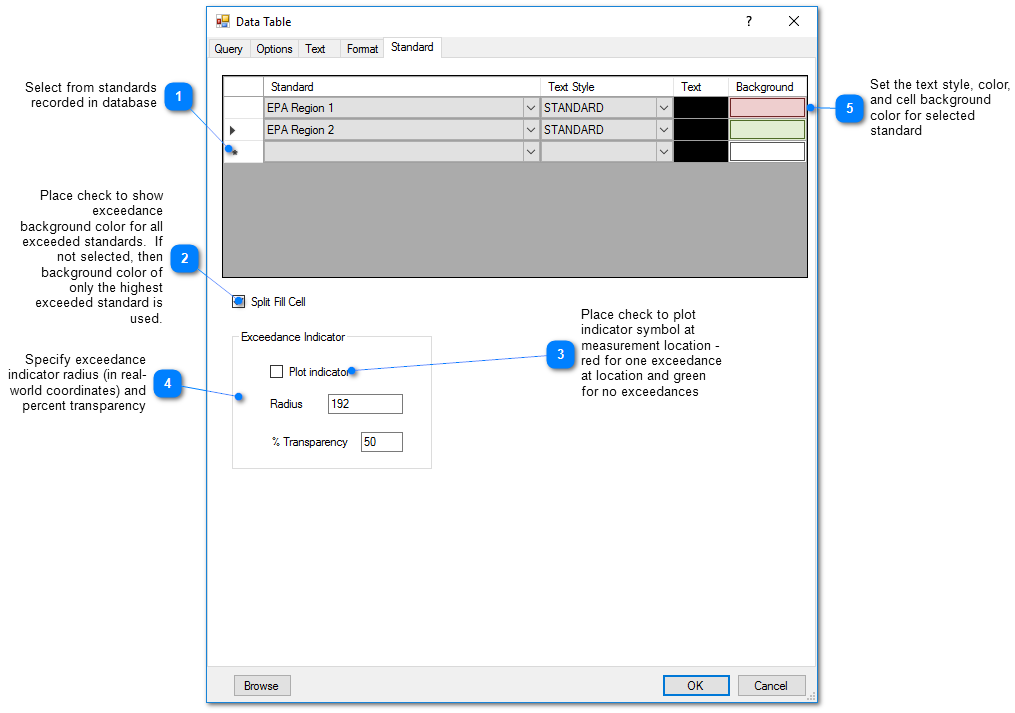
Please refer to the Document tab on the View Options documentation page for guidance on how to change additional settings, such as choosing the exceedance comparison operator (i.e., "> standard value" or ">= standard value").