Georeferenced time-history charts may be used to show the change in concentration of multiple constituents over time. Options include multiple axes, trend lines, and presentation of regulatory standards.
Click Plot> 2D Data from the main menu and select Graph. The FormSelectConstituent window opens. After selecting the desired constituent(s), the Time Series Graph dialog box opens. Modify the graph properties on the Query tab, Line Format tab, Time Axis tab, Left Axis tab, Right Axis tab, Options tab, Format tab, Standards tab, and EQuIS Query tab as desired. Click the OK button to save changes.
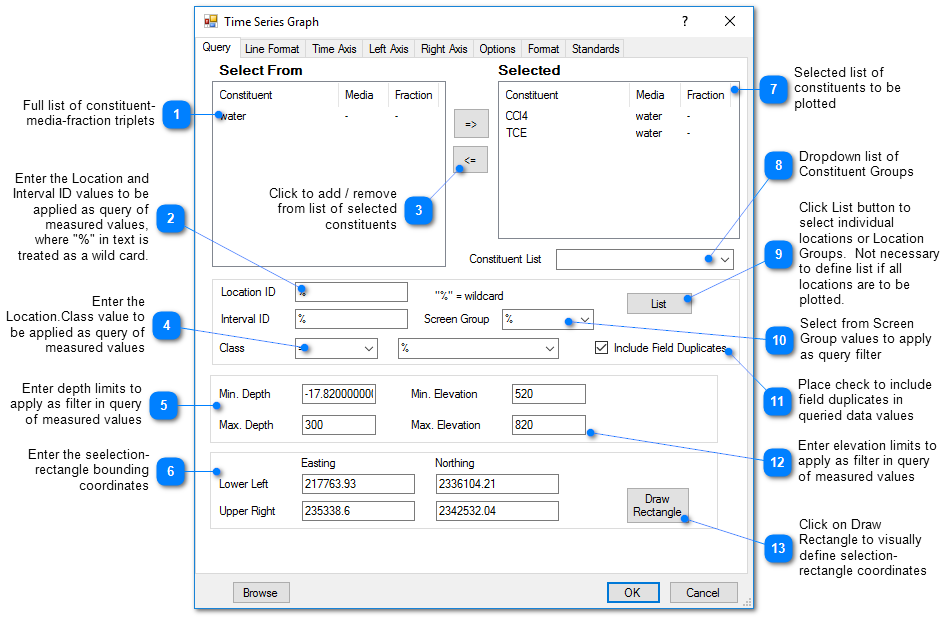
Query Tab
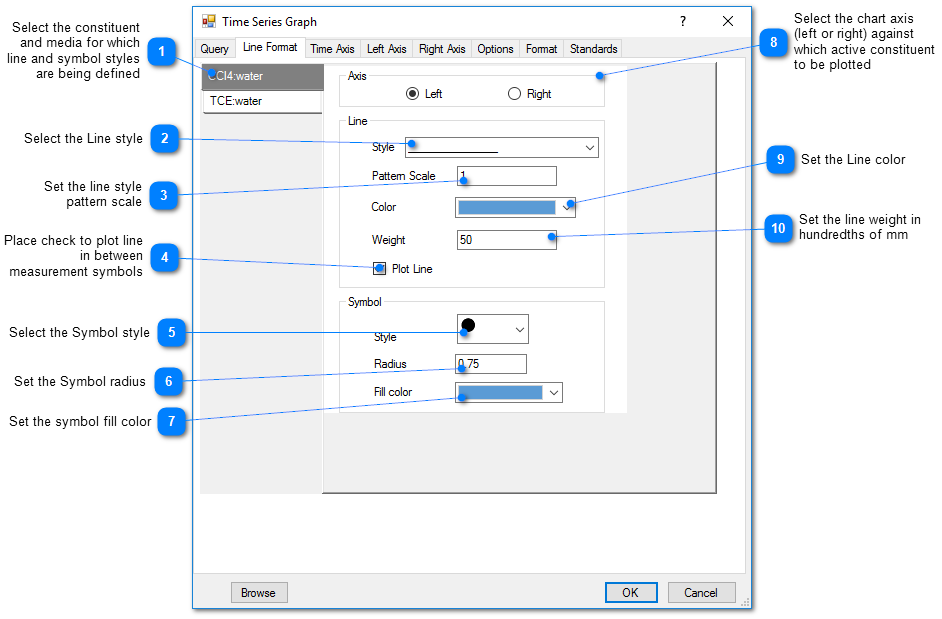
Line Format Tab
Time Axis Tab
Set the properties for the X-axis. The date range for the graphs can be entered directly or selected with the drop-down calendar. A variety of time intervals for the axis labels are available. Set the date format and angle for the time axis labels.
Left / Right Axis Tabs
The left and right axes is the primary and secondary Y-axis, respectively. Set the properties of the axes.
•Interval: Specify the interval between labels on the vertical axis. When Log Scale is chosen, the interval is integral powers of 10 (0.01, 0.1, etc.).
•Digits Right of Decimal: Select the number of digits right of the decimal shown on the vertical axis.
•Log Scale: Check to plot using a log scale.
•Scientific Notation: Check to post values on axis using scientific notation.
Options Tab
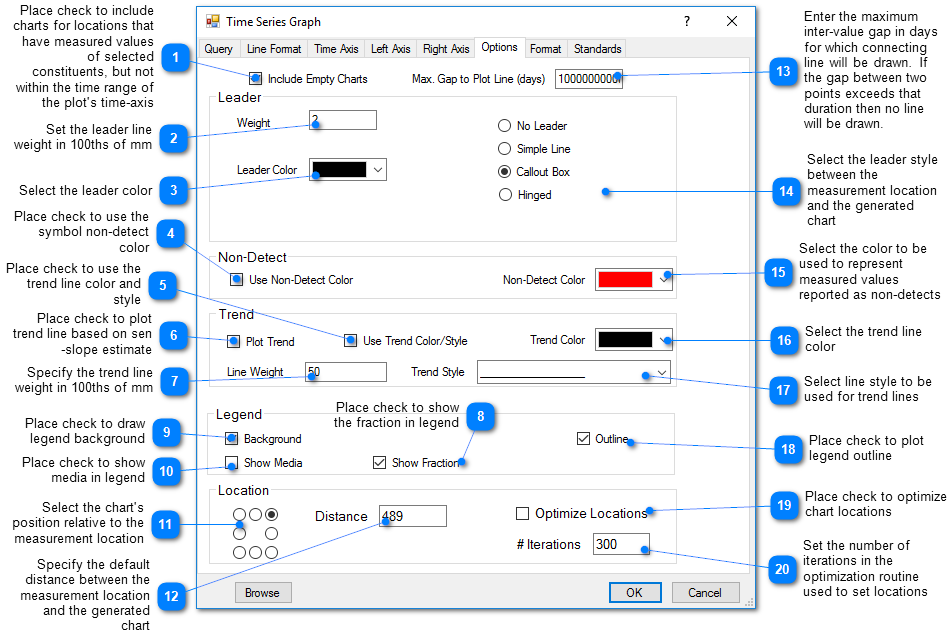
Max. Gap to Plot Line (Days) – Indicate the maximum inter-value gap in days for which a connecting line will be drawn. If the gap between two points exceeds that duration then no line will be drawn.
Trend – EnviroInsite uses the Sen Slope method described in EPA/240/B-06/003 for plotting of trend lines. The Sen Slope is a non-parametric method calculated as the median of the slope between all measurement pairs. The trend line is set to pass through a point set to the median of the sample dates and the median of the plotted values.