The EDGE Field EDD can export an expected water level and/or LNAPL range for a given location based on historical data. These ranges are calculated in a way that can statistically exclude outlier data. EDGE can show these historical ranges to the user and raise alerts if values are entered which fall outside the range.
Export an EDGE Field EDD
1.Open the EDGE Field EDD Report in EQuIS Professional or in EQuIS Sample Planning Module (SPM).
2.Enter a value in the "Historical\Water Levels\Years back" and/or "Historical\LNAPL\Years back" parameters (e.g. "10" for last ten years).
3.Select a value from the "Historical\Water Levels\Historical range outlier" and/or "Historical\LNAPL\Historical range outlier" parameter list. This parameter dictates what percentage of outlier data should be removed from the export. It is set to 5% by default. See "How EDGE calculates historical ranges" later in this article for more details on how outliers are handled.
4.Choose other parameters as desired.
5.Run the report. The EDGE EDD (*.xls) should now contain the historical ranges in an EDGE_Historical worksheet tab. The Value_Parameter column will be set to "WL_RANGE" or "LNAPL_RANGE" as appropriate.
Use the Historical Range Check in EDGE
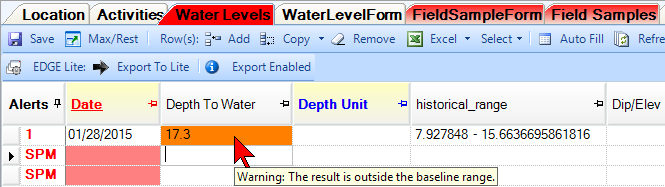
1.Ensure the necessary data fields are shown on the Water Levels tab (directions in article Column Chooser, Water Level Form or Field Sample Form's Water Level section):
a.historical_range
b.water_level_depth
c.(for LNAPL) lnapl_depth
d.(for LNAPL) historical_range_lnapl
2.Open EDGE and load the EDD exported earlier.
Note: Blank historical_range and historical_range_lnapl fields may be seen if the text "SPM" appears in the Alerts column. This appears when the EDGE EDD is generated from an SPM plan. When the SPM alerts on a data row are resolved (i.e., required data fields are populated), the range will appear. |
3.Enter a value in water_level_depth (or lnapl_depth) outside the range shown in historical_range (or historical_range_lnapl). EDGE will throw a warning and highlight the field.
How EDGE Calculates Historical Ranges
EDGE uses statistics to calculate historical ranges that exclude outlier data. It uses the the following formula:
R must fall between (Mean - X*STDEVP) and (Mean + X*STDEVP), where R is the water level or LNAPL reading and X values are determined from the user's input in the Historical Range Outlier parameter(s).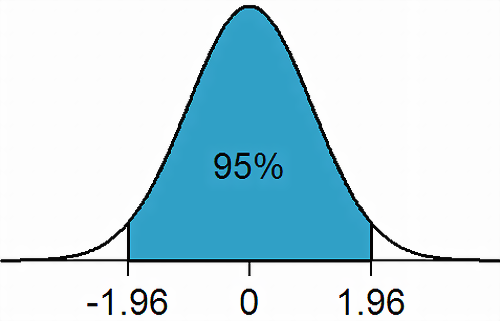
% Under Normal Distribution |
Report Parameter |
X Value |
|---|---|---|
100% |
0% |
7 |
99% |
1% |
2.275829 |
95% |
5% |
1.959964 |
90% |
10% |
1.644854 |
80% |
20% |
1.281552 |
70% |
30% |
1 |
50% |
50% |
.067449 |
Example
There are 15 water level readings recorded for a location.
Number of Readings |
Depth to Water |
|---|---|
1 |
44.2 |
2 |
48 |
3 |
48.2 |
4 |
49.2 |
5 |
49.2 |
6 |
49.3 |
7 |
49.3 |
8 |
49.3 |
9 |
49.3 |
10 |
49.8 |
11 |
50.1 |
12 |
50.2 |
13 |
50.5 |
14 |
51 |
15 |
55 |
Assume that any data that do not lie under 95% of the area of the normal distribution should be excluded. The calculation follows:
Mean = 49.5
X*STDEVP = 4.136
Historical Range = between 45.4 and 53.6
The values 44.2 and 55 fall outside the range and will be excluded.